
Strengthening pharmaceutical quality in the Pharma 4.0 era:A cause analysis solution to prevent deviations from standards
Maintaining stable quality in pharmaceuticals is a critical issue that directly impacts human lives.
At B-EN-G, we utilize AI and DAG (Directed Acyclic Graph) to conduct rapid root cause analysis and provide factor analysis solutions that refine our customers' decision-making.
Overview
In order to precisely monitor the manufacturing process and consider measures to stabilize quality, it is essential to use a system for accumulating and analyzing data.
However, recent studies have shown that
1) Utilization rate of production management software: 49% (according to Biovia)
2) Utilization rate of pharmaceutical manufacturing data: 30% (according to Bigfinite)
Reports indicate that the industry as a whole is still at a low level.
Each pharmaceutical process has a different primary purpose for utilizing data.
The diagram below summarizes the purpose and direction of data utilization in the pharmaceutical ingredient process, formulation process, and packaging process.
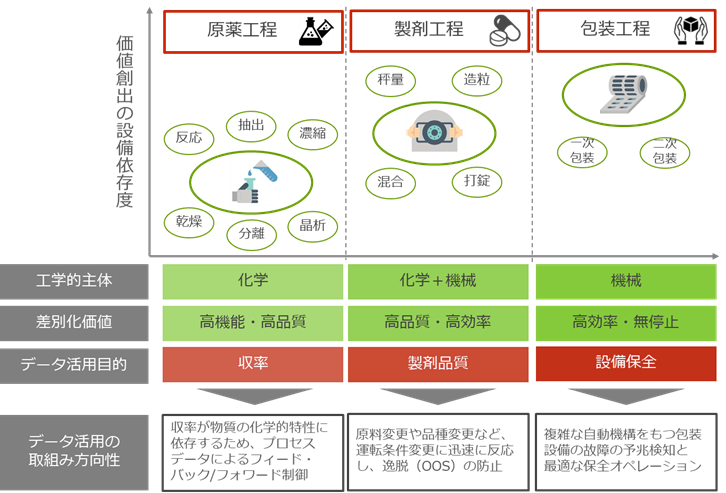
[Figure: Direction of data utilization in manufacturing processes]
Even if the target quality is achieved in the drug substance process and packaging process, in order to "deliver high-quality medicines to patients," quality control in the formulation process, which determines the final quality of the medicine, is the key. Below, we will introduce quality control solutions that focus on using data in the formulation process.
The diagram below summarizes factory operations during the occurrence of out of trend (OOT) and out of specification (OOS).
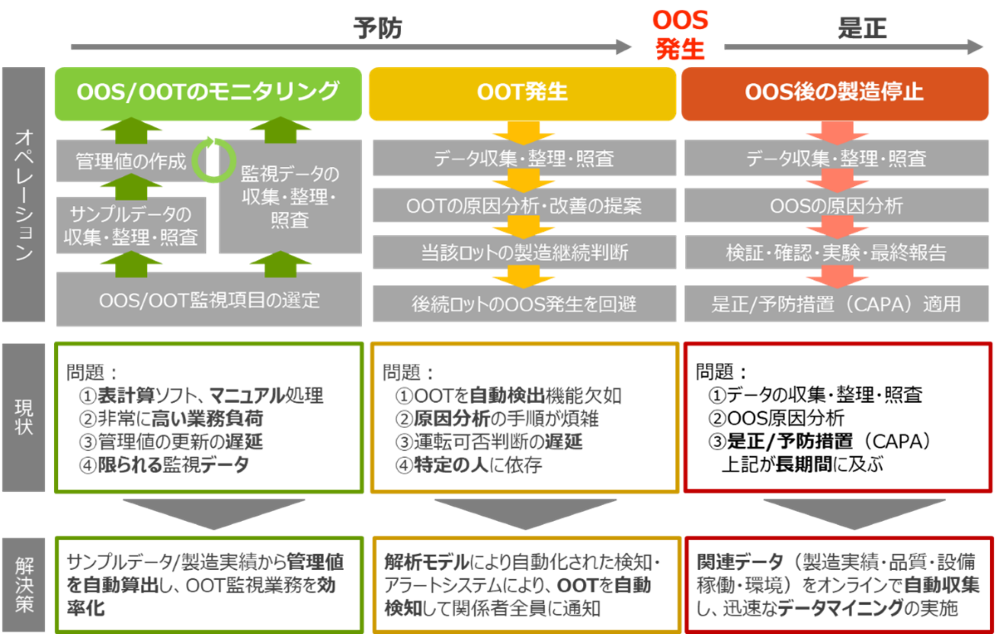
[Prevention and correction of OOT and OOS]
In many factories, process data and quality data are not fully utilized, which can lead to delays in detecting anomalies and make root cause analysis highly dependent on individual expertise.
By implementing real-time monitoring and addressing issues at the OOT (Out of Track) stage, OOS (Out of Service) can be prevented, minimizing costs and risks if it does occur.
Quality control solutions to prevent deviations from standards
Case Study
We will introduce an example of using one cycle of quality control: "OOT detection ⇒ cause analysis ⇒ preventive measures ⇒ real-time monitoring and feedback loop."
1. OOT detection
It monitors various process parameters (temperature, humidity, pressure, etc.) and test values such as API and product tests in real time to detect trend abnormalities (OOT) that are outside the normal range. In this example, we will assume that OOT is detected for dissolution. Detecting abnormalities at this stage is the first step to prevent OOS later.
2) Cause analysis
When OOT is detected, machine learning is used to learn a Directed Acyclic Graph (DAG) to quickly analyze the cause. A DAG is like a correlation diagram that shows the relationships between parameters and is used for causal inference.
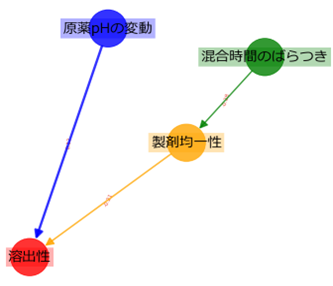
[Figure DAG showing the relationship between parameters at the commercial production stage]
When DAG learning is performed on commercial production data, it is possible to find relationships that differ from those found in the research and development stage. From the DAG in this example, we can deduce several factors that may affect dissolution, as follows:
Fluctuation in pH: The pH value of the drug substance was outside the normal range, causing abnormalities in dissolution.
Variation in mixing time: The mixing time during the manufacturing process was not consistent, which affected the uniformity of the product and caused abnormalities in dissolution.
3) Preventive measures
Based on the identified causes, we will devise and implement the following preventive measures:
- pH value control: The pH value of the pharmaceutical ingredients is strictly controlled, and any abnormalities are promptly adjusted.
- Standardization of the mixing process: Process standardization will be carried out to keep the mixing time constant, ensuring product uniformity.
④Real-time monitoring and feedback loop
Even after preventive measures have been implemented, we continue to monitor the data in real time and maintain a system in place to immediately respond if anomalies reoccur, creating a feedback loop that allows for continuous process improvement.
By continuing to utilize data as described above, we can expect to achieve even greater quality improvements and cost optimization.
For over a quarter century, we have been researching advanced methods of system construction and data analysis for pharmaceutical manufacturers, and we offer optimal solutions tailored to the needs of the field.
Testimonials from customers we have helped:
"We uncovered new relationships that were not academically obvious and had not been discovered before."
"People scientifically analyze data and make decisions based on the suggestions it suggests, which is what gets people and organizations moving."
Related Solutions
DcX Support Services (Data Centric Transformation)
B-EN-G defines DcX (Data Centric Transformation) as not only visualizing the processes of each department by linking applications such as ERP, MES (Manufacturing Execution Management System), LIMS (Quality Test Management System), and IoT, but also combining and utilizing the data generated from them to achieve overall optimization and create new value.
We support the development of integrated platforms that connect applications and data, helping companies realize data-driven management.