

Transcript of the FY2025 Financial Results Presentation and Growth Strategy "BE 2030" Explanation (including Q&A session)
The briefing presentation content is posted below in both text and slide images.
Today's Agenda
Masakazu Haneda: I am Masakazu Haneda, President and CEO of Business Engineering Corporation I will now explain our financial results for the fiscal year ending March 2025. In addition, we announced our new growth strategy "BE 2030" today, which I will explain in detail after the financial results presentation.
Executive Summary of FY2024 Financial Results
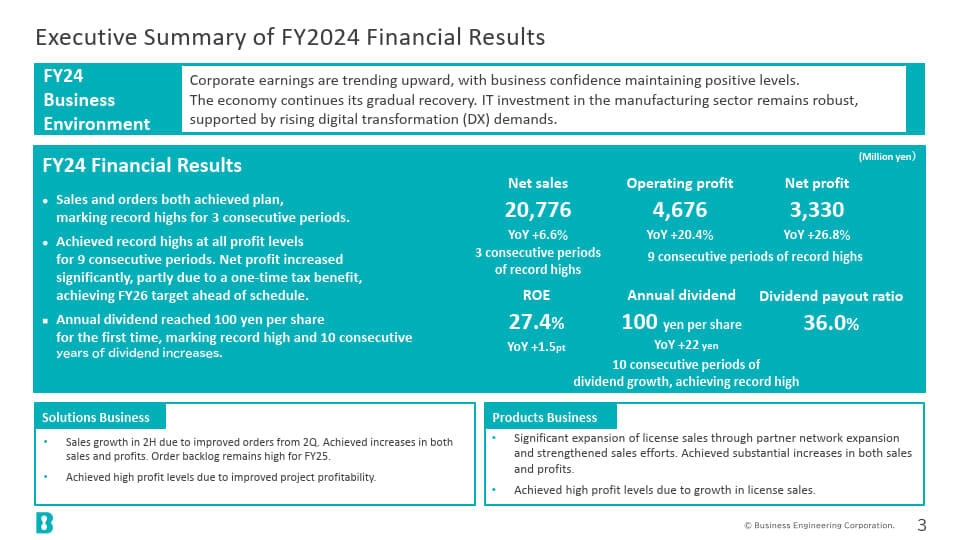
This is a summary of the fiscal year ending March 2025. In terms of the business environment, corporate earnings are on an improving trend, and business sentiment is expected to remain at a favorable level. In response to growing needs for digital transformation, information technology investment in the manufacturing industry has remained steady.
Against this backdrop, our performance saw us achieve our targets in terms of both sales and orders, reaching new record highs for the third consecutive term.
Additionally, we have achieved record highs for each profit level for nine consecutive periods. Net profit has increased significantly due in part to a one-off tax reduction, and we have achieved the final target of our medium-term plan, "Management Vision 2026," ahead of schedule. Annual dividends reached the 100 yen per share range for the first time, marking the 10th consecutive period of dividend increases and the highest level ever.
Summary of Consolidated Income Statement
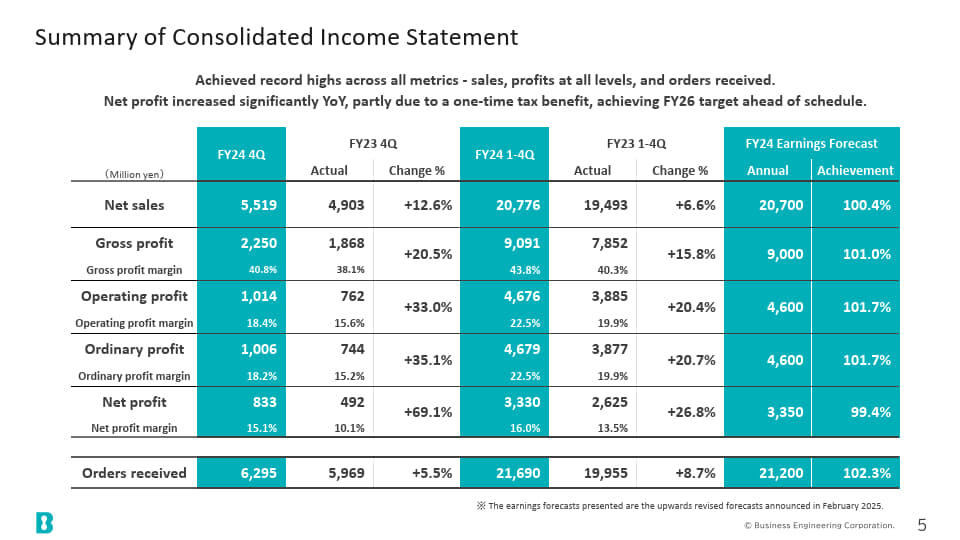
I would like to explain our performance for the full fiscal year ending March 2025. First, the highlights of our consolidated P/L. We achieved record highs in all indicators, including sales, profits at each stage, and orders received.
Starting from the left side of the slide, we have the fourth quarter alone, the full-year cumulative total, and the full-year performance forecast and its achievement rate. All indicators for the fourth quarter alone and the full-year cumulative total exceeded those of the previous fiscal year, and we have generally achieved our targets.
Sales were 20,776 million yen, up 6.6% from last year, operating income was 4,676 million yen, up 20.4% from last year, and net income was 3,330 million yen, up 26.8% from last year. Orders also increased 8.7% from last year to 21,690 million yen, maintaining a record high.
Analysis of Changes in Operating Profit (YoY)
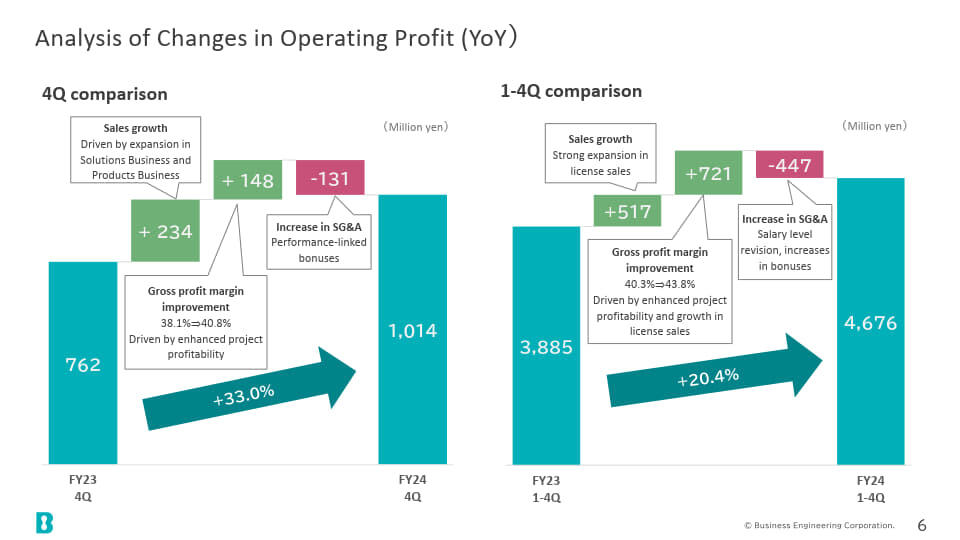
This is an analysis of the increase and decrease in operating profit. The left side of the slide shows the fourth quarter alone, and the right side shows the full-year cumulative comparison. In both charts, profits are increasing due to increased sales and improved gross profit margins.
The main factors behind this are an increase in license sales and improved project profitability. The increase in SG&A expenses was mainly due to salary level revisions, but this was offset by the increased costs of investing in human resources, resulting in a significant increase in profits.
Sales & Operating Profit by Segment
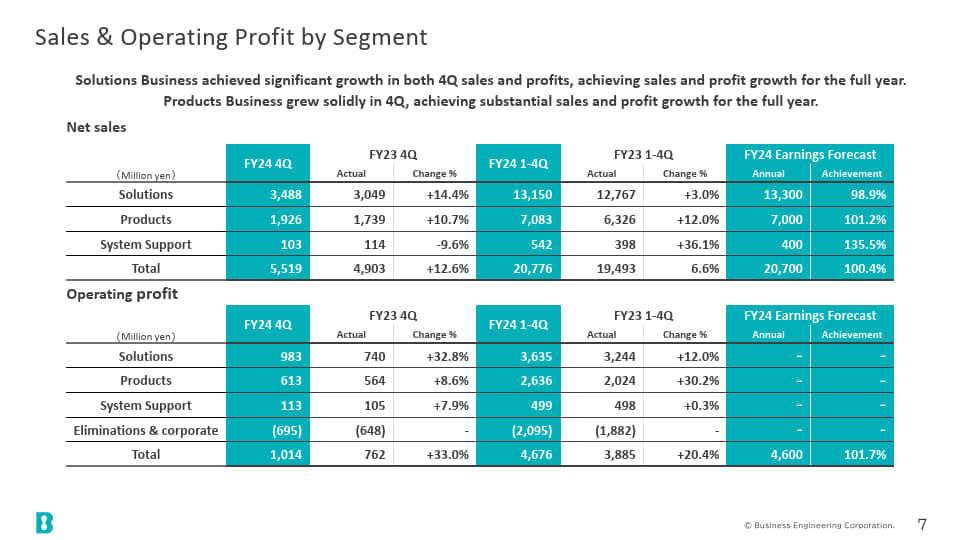
I will now explain the sales and operating income of each segment. The Solutions Business saw significant growth in both sales and income in the fourth quarter alone. As a result, the Business achieved increases in both sales and income for the full year. The Products Business made steady progress in the fourth quarter, achieving significant increases in sales and income for the full year. All segments achieved increases in sales and income compared to the previous fiscal year.
Segment Information: Solutions Business
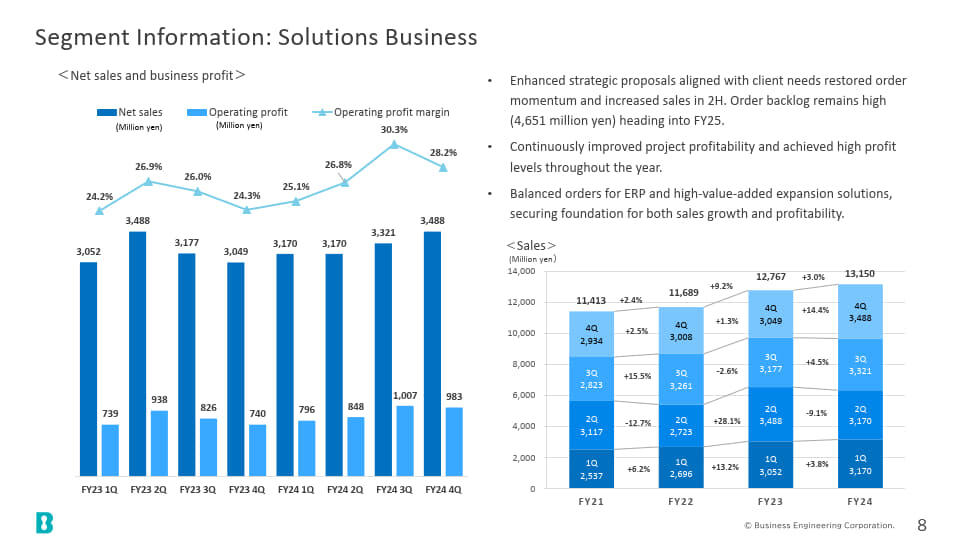
I would like to explain about our solutions business. By implementing more strategic proposals that meet customer needs, orders recovered and sales increased in the second half of the year.
In addition, the improved profitability of the project enabled the company to maintain a high level of profits throughout the year. By proposing a combination of ERP and high-value-added expansion solutions, the company secured a foundation for both sales growth and profitability.
Segment Information: Products Business
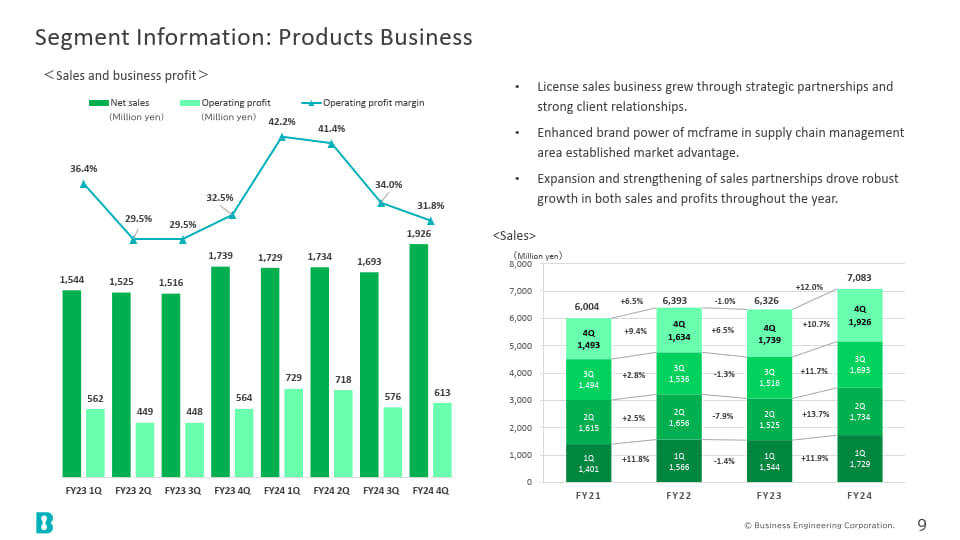
I would like to explain our product business. Our license sales business has grown steadily thanks to strategic partnerships and strong relationships with customers. The brand power of "mcframe" has improved in the supply chain management field, and we have established a market advantage, which has led to a significant increase in license sales.
The operating profit margins for both the Solutions Business and the Products Business declined in the fourth quarter alone, due to factors such as investments in human resources, salaries, and provisions for performance-linked bonuses.
mcframe license Sales
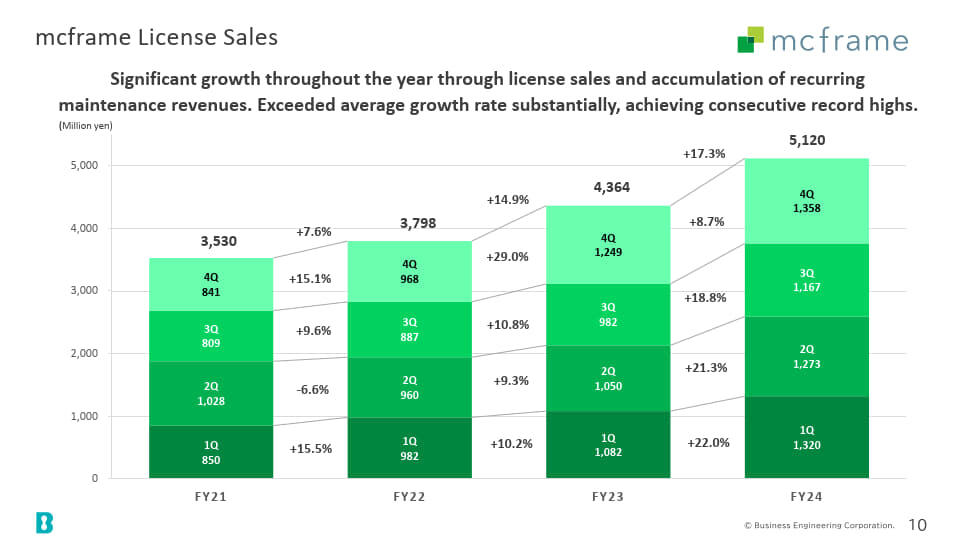
I would like to explain about the license sales of "mcframe". We were able to achieve significant growth throughout the year, thanks to the accumulation of license sales and maintenance service income. This has exceeded the average growth rate to date, and has been continuously breaking all-time highs.
Summary of Consolidated Balance Sheet
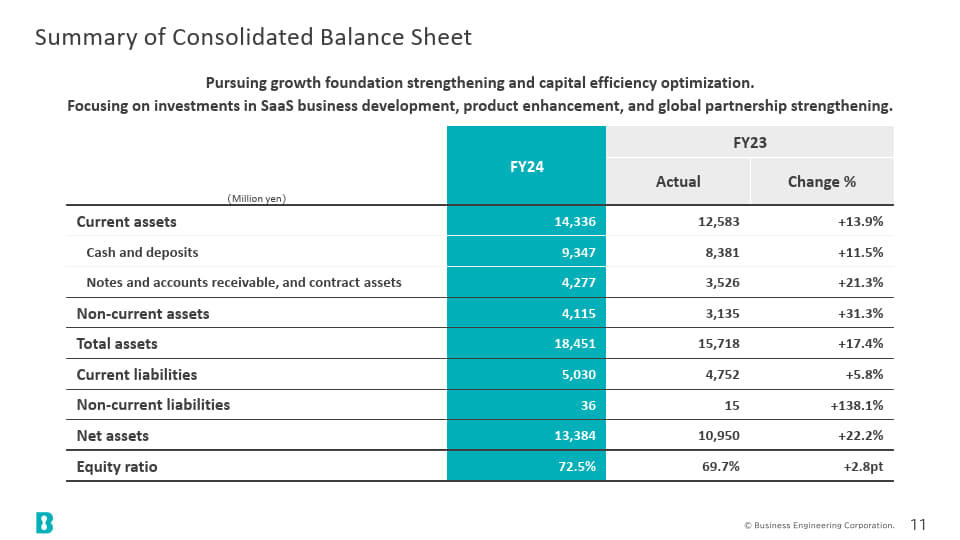
I would like to explain our consolidated balance sheet. We have strengthened our growth foundation and optimized capital efficiency. Fixed assets have increased as a result of our investments to develop our SaaS business, strengthen our product capabilities, and strengthen our global partnerships.
Summary of Consolidated Cash Flows
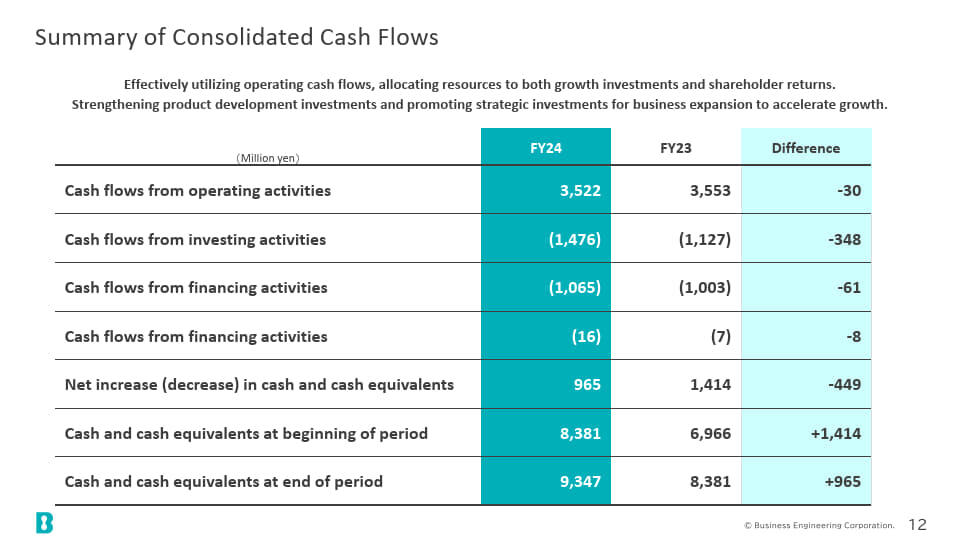
I will now explain the overview of our consolidated cash flow. We made effective use of the operating cash flow we obtained, and promoted the allocation of management resources to both investments in growth and shareholder returns. We also strengthened investments in product development to accelerate growth, and promoted strategic investments for business expansion.
About BE 2030
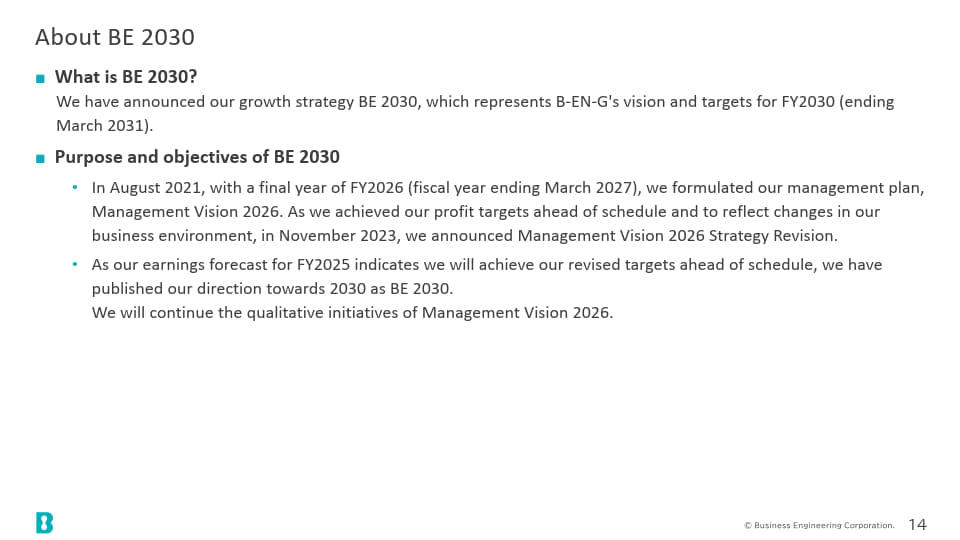
Based on the progress of our medium-term management plan, "Management Vision 2026," we have announced "BE 2030," which outlines our growth strategy and the vision for B-EN-G for fiscal year 2030 (ending March 2031). I would like to give you a brief explanation of this.
Achievements from Management Vision 2026
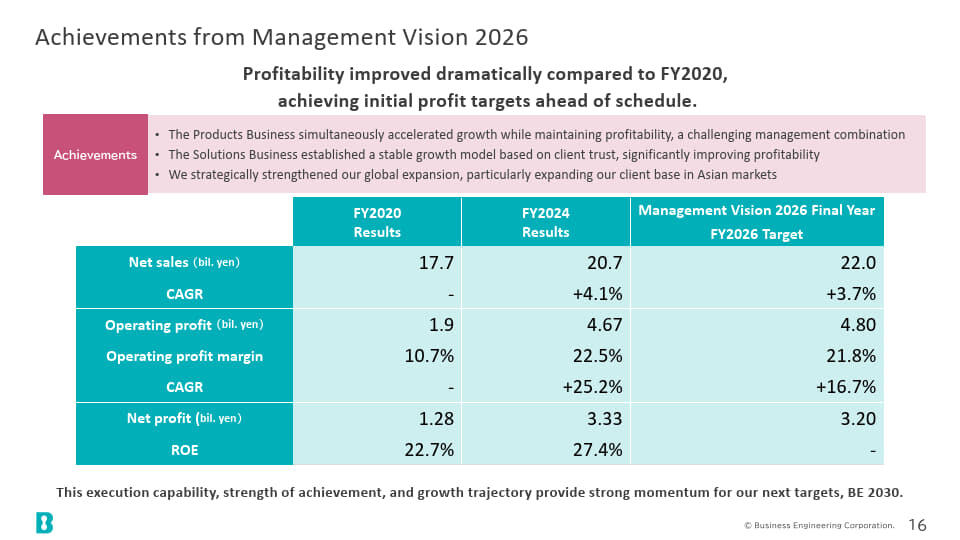
I would like to explain the results we have achieved through our Management Vision 2026. Compared to fiscal 2020, profitability has improved, and we have achieved our initial profit targets ahead of schedule. Sales have grown from 17.7 billion yen to 20.7 billion yen, while operating profit has expanded by approximately 2.5 times, from 1.9 billion yen to 4.67 billion yen.
Our operating margin improved significantly from 10.7% to 22.5%, and our ROE also improved from 22.7% to 27.4%.
We believe that we have made progress in both profitability and capital efficiency, and we believe that this ability to execute, realize, and grow will be the driving force behind our next goal, "BE 2030."
I will provide a detailed explanation of "BE 2030" elsewhere, so I will not go into detail here.
About BE 2030 Details
In addition, we have posted detailed information on our IR website. Please take a look there as well.
Executive Summary of FY2025 Earnings Forecast
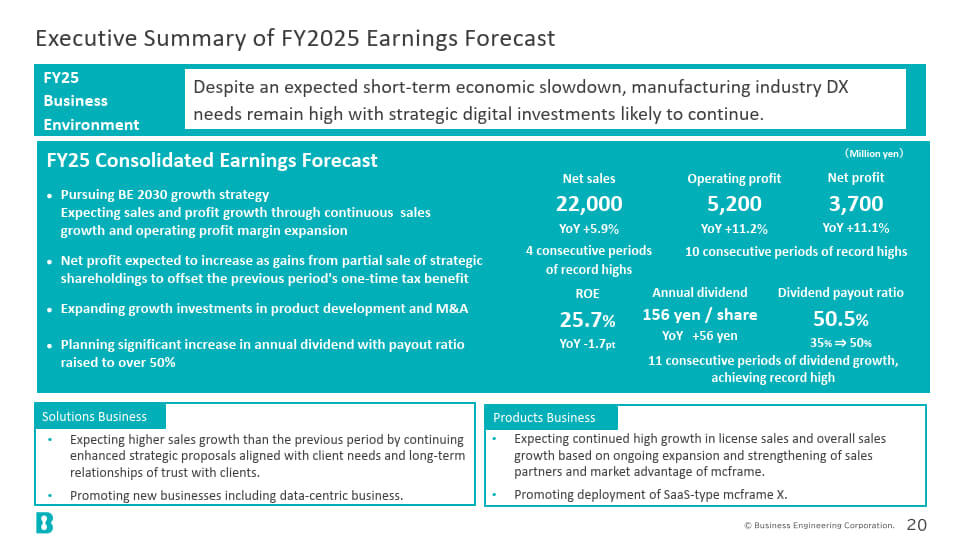
I would like to explain our business outlook for the fiscal year ending March 31, 2026. In terms of the business environment, we expect economic growth to slow in the short term due to the impact of trade policies in various countries.
However, the need for digital transformation in the manufacturing industry is high, and we expect strategic digital investments to continue. By promoting our growth strategy through "BE 2030," we expect to see continued sales growth and improved operating profit, resulting in increased revenue and profits.
We forecast sales of 22 billion yen, operating profit of 5.2 billion yen, and net profit of 3.7 billion yen. Net profit is expected to increase as the gain on the sale of some cross-shareholdings will cover the temporary tax reduction from the previous fiscal year.
We will continue to expand growth investments, including investments in product development. We plan to raise the dividend payout ratio to over 50 percent and significantly increase annual dividends.
Earnings forecast
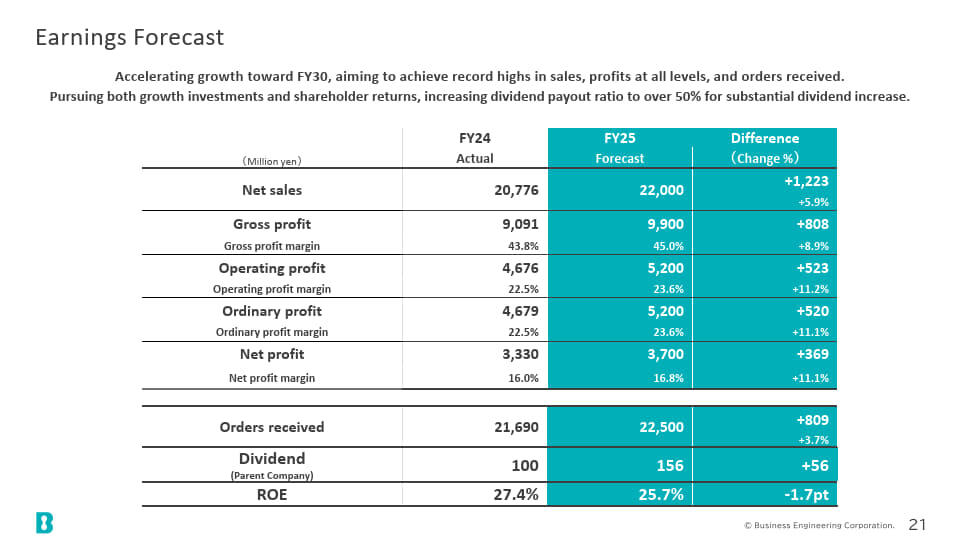
I would like to explain our full-year business outlook. We will accelerate growth toward fiscal 2030, aiming to achieve record highs in sales, profits at each stage, and orders received. We plan to promote both growth investments and shareholder returns, raising the dividend payout ratio to 50%, and significantly increasing dividends.
We expect sales to increase 5.9 percent to 22 billion yen, operating profit to increase 11.2 percent to 5.2 billion yen, and net profit to increase 11.1 percent to 3.7 billion yen.
In order to strengthen shareholder returns, we plan to change our dividend policy to raise the dividend payout ratio to over 50%, and balance growth investments with shareholder returns. We will increase dividends by 56 yen from 100 yen to 156 yen. Orders received are also expected to grow, increasing 3.7% year on year to 22.5 billion yen.
Earnings Forecast (1H/FY)
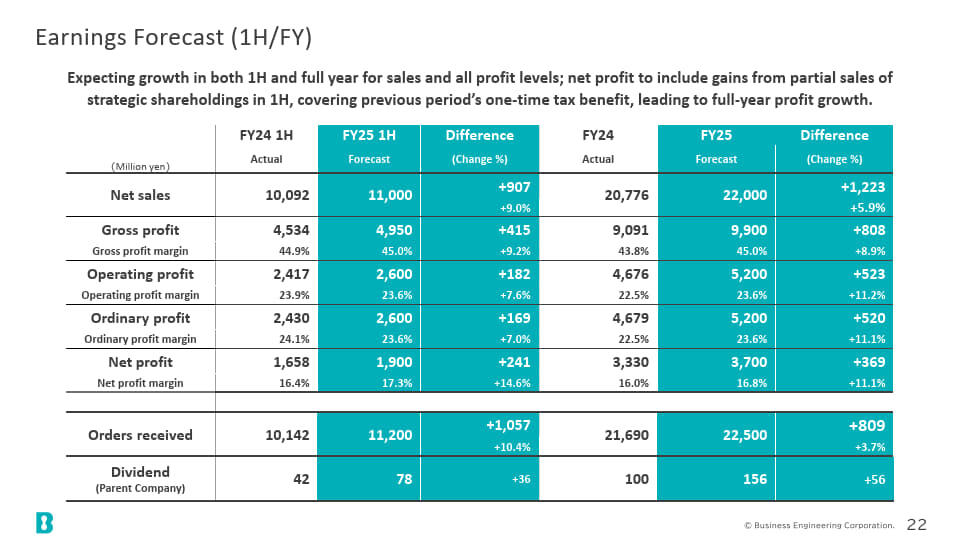
This is the business outlook for the first half and full year. We expect growth in sales and all profit levels for both the first half and full year. As I explained earlier, we expect to record a gain on the sale of some cross-shareholdings in the first half of the year for net income. This will cover the temporary tax reduction from the previous fiscal year, and we expect to see an increase in profits for the full year.
Earnings Forecast (1H/2H/FY)
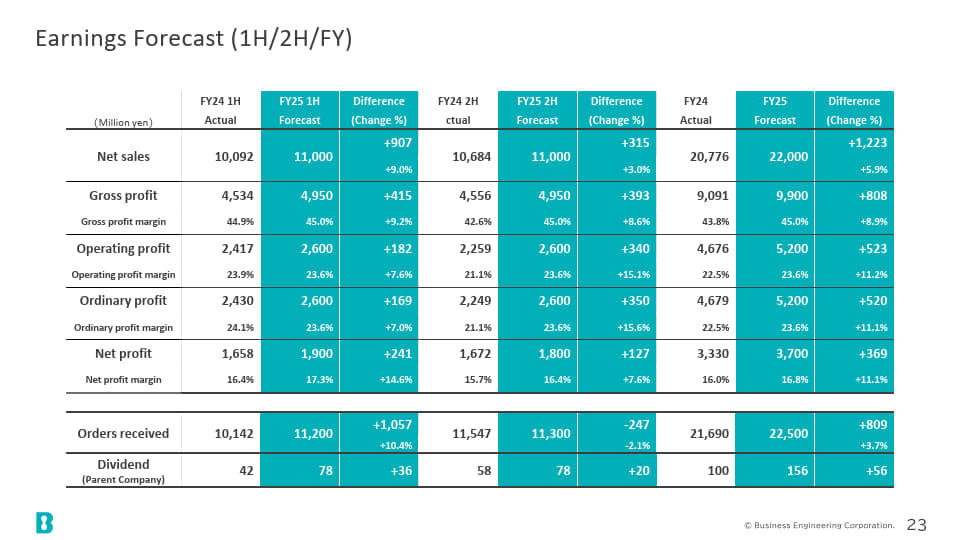
The slide is a table showing the balance for the first half, second half, and full year.
Segment & mcframe License Sales Forecasts (FY)
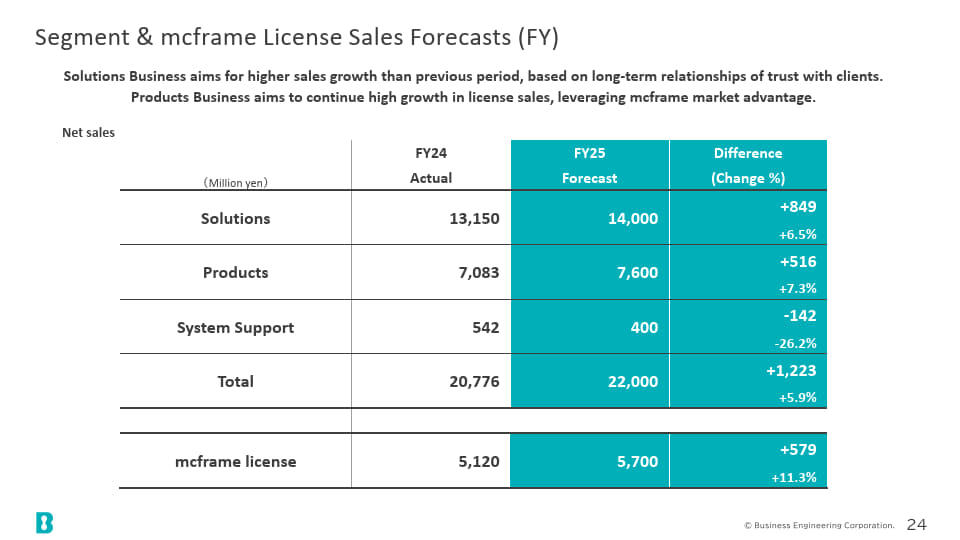
This is the full-year sales outlook for the segment and "mcframe" licenses. The solutions business will aim for higher sales growth than the previous fiscal year, backed by long-term relationships of trust with customers. The product business will aim for continued high growth in license sales, backed by the market dominance of "mcframe."
Segment & mcframe License Sales Forecasts (1H/FY)
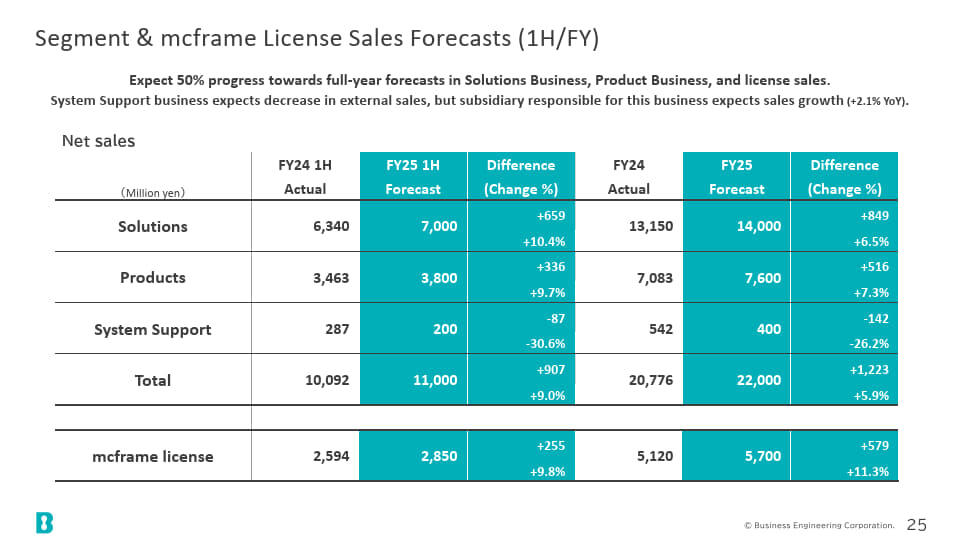
Outlook for segments and "mcframe" license sales for the first half and full year. We expect sales in the Solutions Business, Product Business and License Sales in the first half to account for approximately 50% of the full year.
In the system support business, external sales are expected to decrease, but the subsidiary that handles the business is expected to see an increase in sales.
Segment & mcframe License Sales Forecasts (1H/2H/FY)
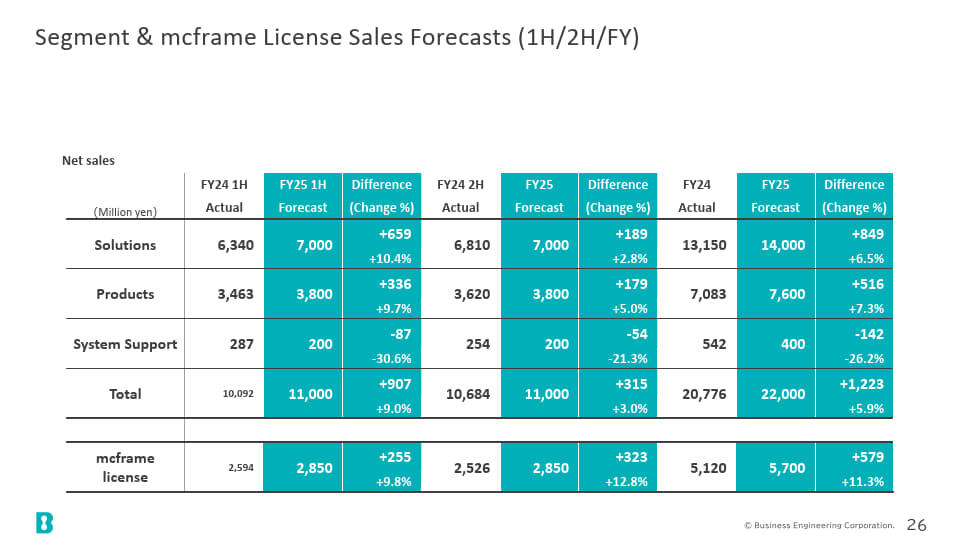
The slide shows the balance of segments and "mcframe" license sales between the first and second half of the year.
Solutions Business Forecast
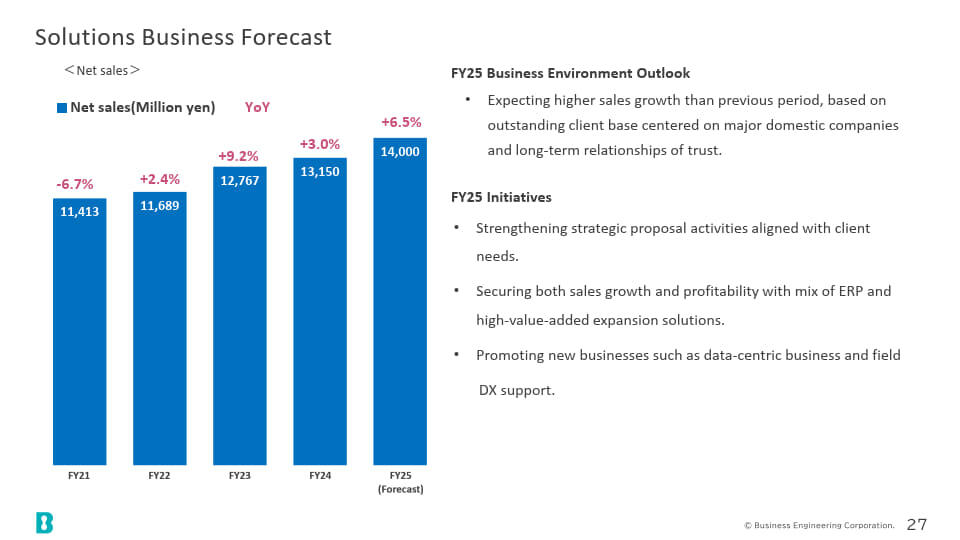
I would like to explain the outlook for the Solutions Business. First, in terms of the business environment, we expect higher sales growth than in the previous fiscal year, backed by our long-term relationships of trust with our customer base, which is centered on major clients.
By implementing strategic proposals that meet customer needs and proposing a combination of ERP and high-value-added expansion solutions, we will ensure the foundation for both sales growth and profitability growth. We will also work to develop new businesses, such as supporting data-centric and field digital transformation.
Products Business Forecast
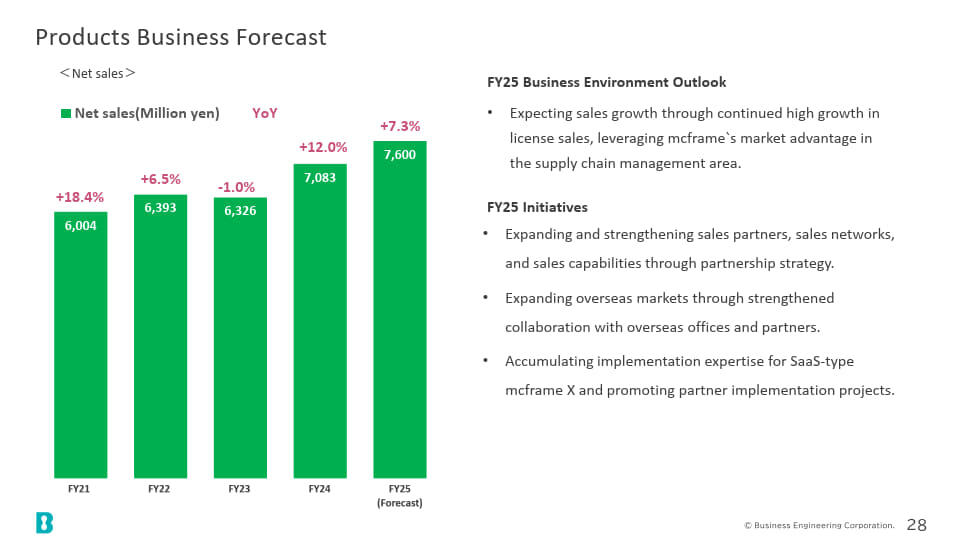
I would like to explain the outlook for the product business. First, in terms of the business environment, we expect sales growth to be driven by continued high growth in license sales, backed by the market dominance of "mcframe" in the supply chain management field.
In terms of initiatives, we will work to strengthen and expand our sales partner network through a partnership strategy. We will also work to expand into overseas markets by strengthening collaboration with overseas bases and overseas sales partners. We will also work to develop new markets by introducing SaaS-type products to the market.
Net Sales and YoY Growth
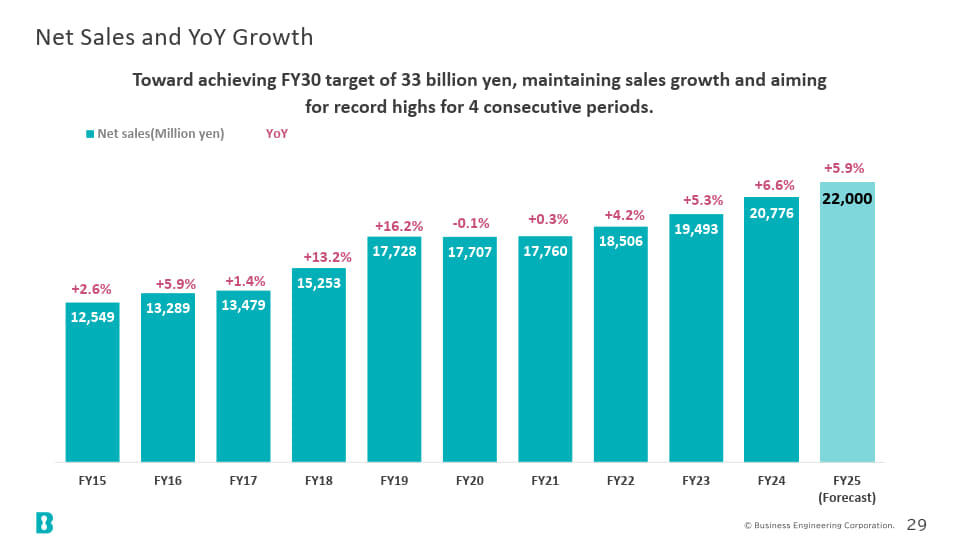
This is a bar graph showing sales revenue and year-on-year change. We will continue to grow sales to achieve our target of 33 billion yen by fiscal 2030, aiming for a fourth consecutive year of record highs.
Looking at the trends over the past 10 years, there has been some variation between fiscal 2018 and fiscal 2021, but you can see that the growth rate has been steadily increasing from fiscal 2022 onwards. By continuing to grow sales going forward, we will solidify our foundation to achieve our long-term target of 33 billion yen.
Operating Profit & Operating Profit Margin
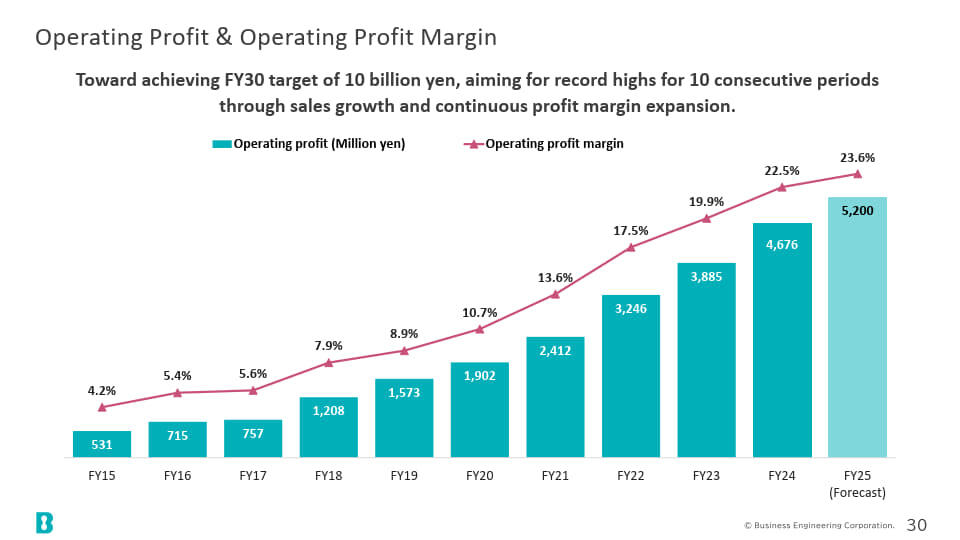
This is a graph showing operating profit and operating profit margin. To achieve our final target of 10 billion yen in fiscal 2030, we aim to achieve our highest figure for 10 consecutive years by growing sales and continuously improving our profit margin. Here too, we expect to grow approximately tenfold from 531 million yen in 2015 to 5.2 billion yen in fiscal 2025.
In particular, you can see that profit margins have shown remarkable growth since fiscal 2020.
mcframe License Sales & YoY Growth
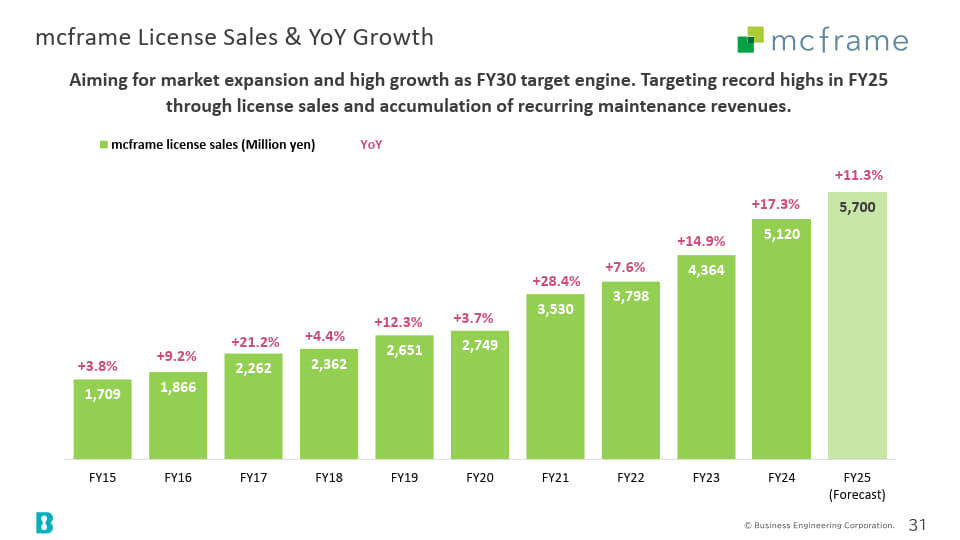
The bar graph on the slide shows the license sales of "mcframe" and the comparison with the previous fiscal year. We view the license sales of "mcframe" as a growth engine for achieving our final goal of fiscal 2030. We will continue to aim to expand our market share and achieve sustained high growth.
We aim to achieve another record high in consecutive sales in fiscal 2025. As a result of approximately 3.3 times growth over 10 years from 1.709 billion yen in fiscal 2015, we are targeting 5.7 billion yen in fiscal 2025.
Sales by Segment
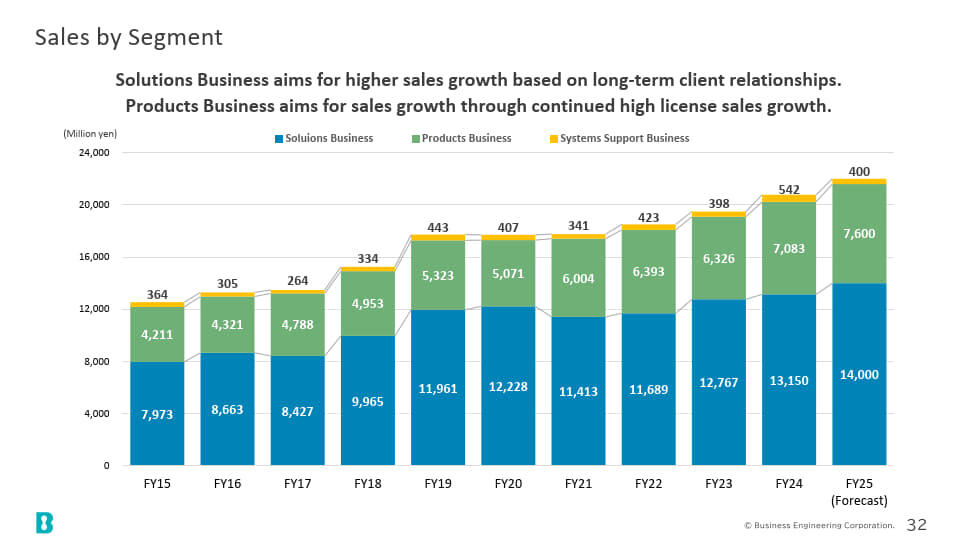
This is sales by segment. Our core businesses, the solutions business and the products business, complement each other and we hope to build a business portfolio that is resilient to economic fluctuations.
Dividends (Annual dividend per share)
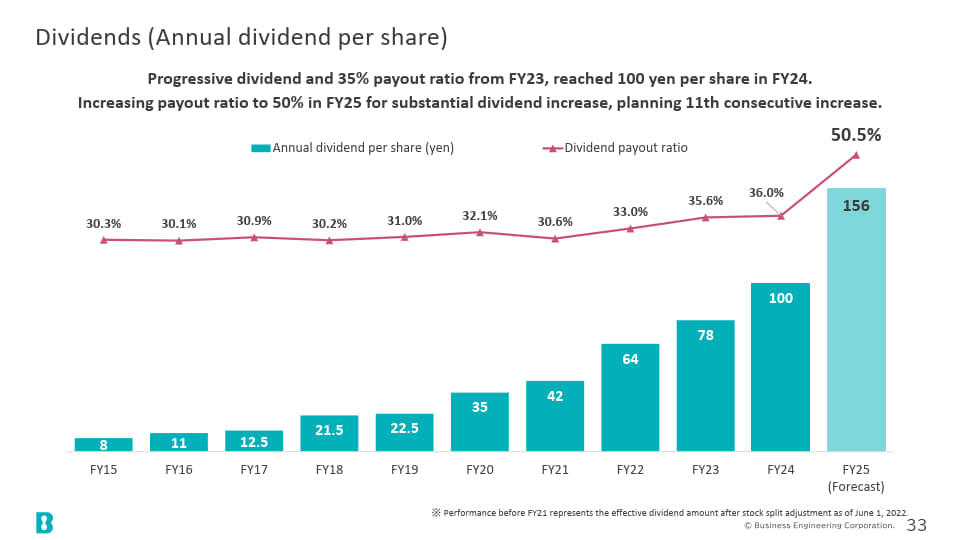
Regarding dividends, our dividend policy has changed significantly over the past 10 years. From fiscal 2015 to fiscal 2022, the dividend payout ratio was over 30%, and from fiscal 2023 onwards, it will be raised to over 35%, and in fiscal 2024, it will exceed the 100 yen per share mark for the first time. From fiscal 2025, it is planned to raise it to over 50%, increasing the dividend by 56 yen to 156 yen. As a result, we expect to achieve 11 consecutive years of increased dividends.
Data Book

Chapter 4 will be the original data and data book, so please take a look at it later.
Integrated Report 2024
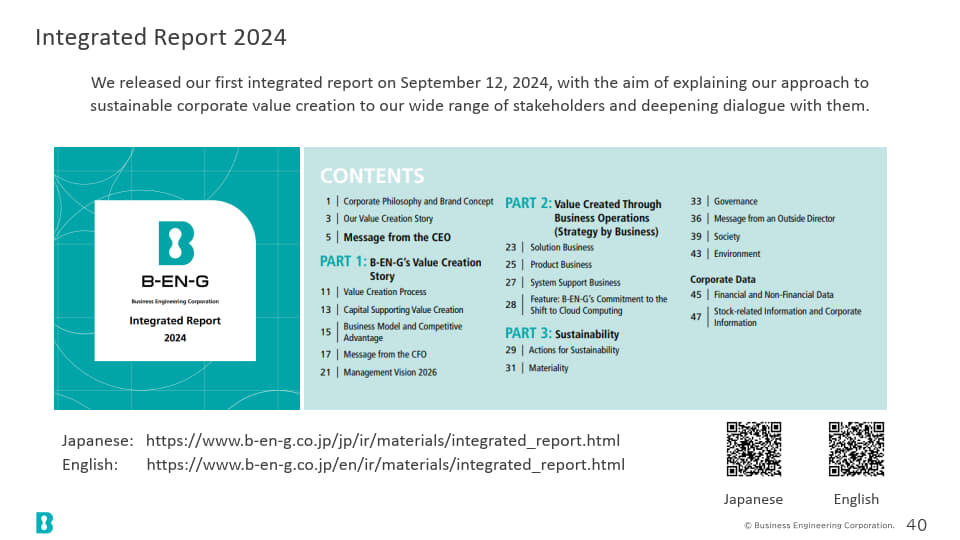
Finally, we will introduce some reference materials related to IR. First, we will introduce our integrated report. Last year, in September 2024, we published our first integrated report.
This integrated report is a document that explains our sustainable corporate value creation to a wide range of stakeholders. Please take a look at the Japanese and English versions of this report, which are available on our website.
Investors Guide
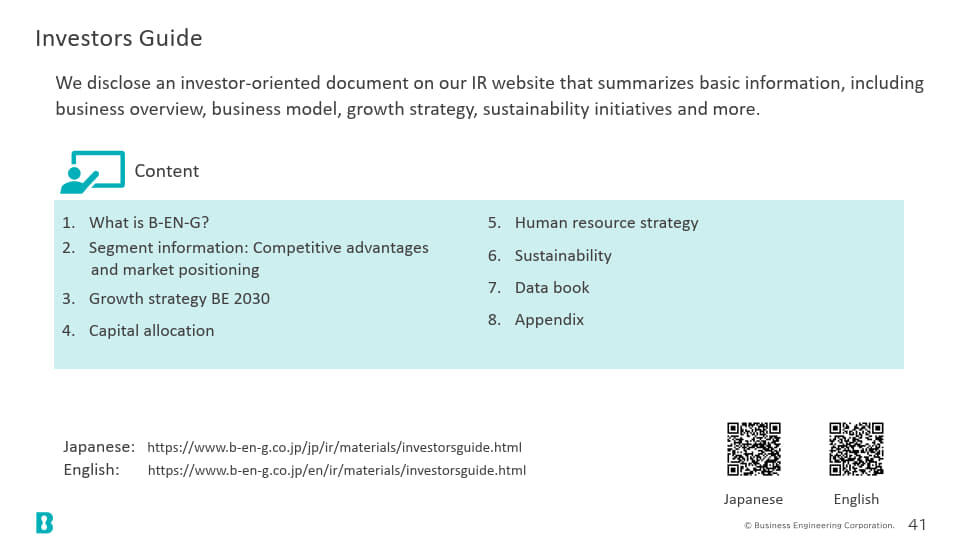
Similarly, we have published an Investor's Guide on our website, which provides information to a wider range of investors, including an overview of our business, business model, growth strategy, and sustainability.
Additionally, detailed information such as the competitive advantages of "mcframe," our growth driver, is also available here. Both Japanese and English versions are available, so please take a look at our website.
Growth Strategy BE 2030
Next, I would like to explain our new growth strategy, "BE 2030."
Introduction | About BE 2030
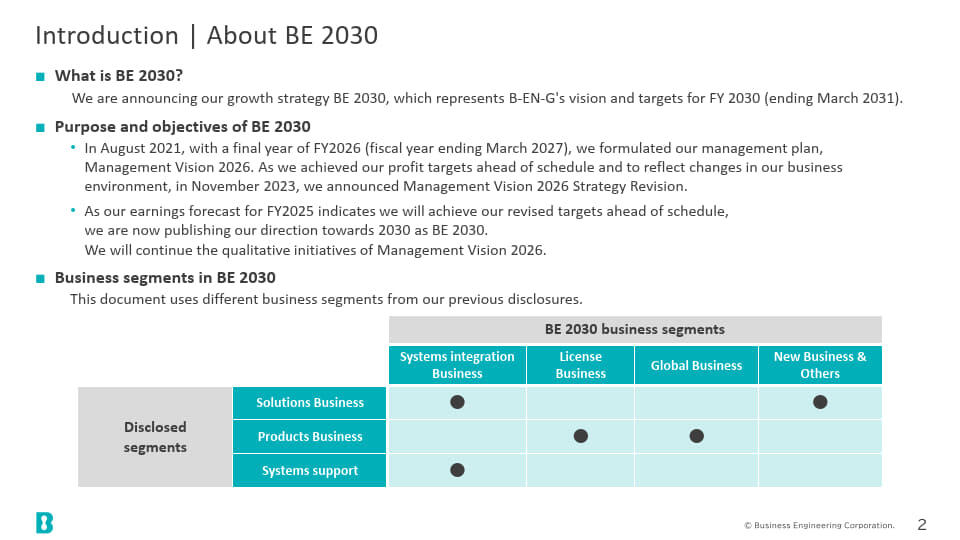
First, let me explain the positioning of "BE 2030." In August 2021, we formulated "Management Vision 2026," a management plan with fiscal 2026 as the final year.
As part of this progress, we have achieved our profit targets ahead of schedule and, to reflect changes in the environment surrounding our company, we announced the Revised Management Vision 2026 in November 2023.
We are currently in the process of making progress, but because we believe it is possible to achieve this revised profit target ahead of schedule in our performance forecast for the fiscal year ending March 2026, we have announced "BE 2030," our new growth strategy for 2030. However, we will continue to implement the qualitative measures of "Management Vision 2026."
The business segments used in "BE 2030" are different from those used in previously published materials. The table below shows the comparison.
Management Vision 2026 Targets and Review
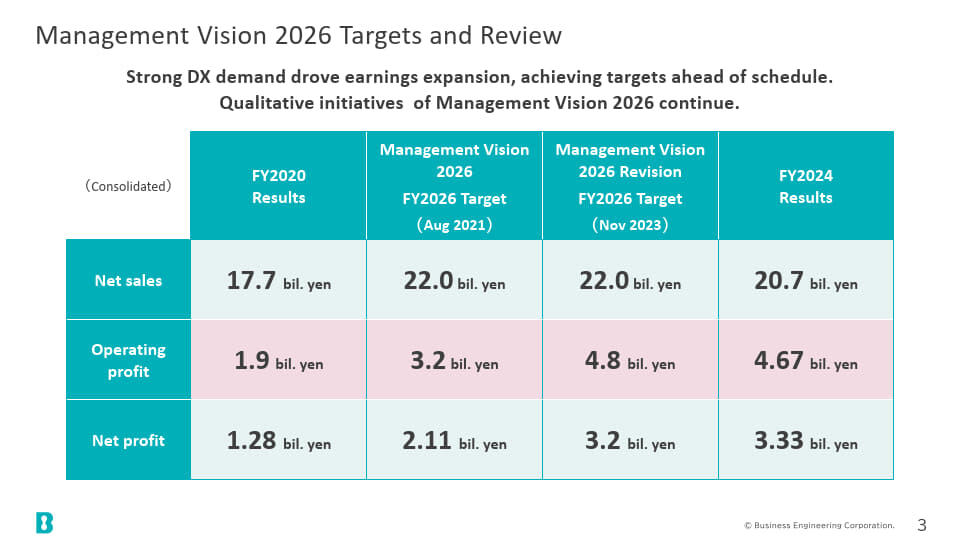
I would like to explain our performance and review of our Management Vision 2026. Profits expanded due to robust demand for digital transformation, and we were able to achieve our targets ahead of schedule. We believe that we have achieved particularly notable results in terms of profitability.
For the fiscal year ending March 2025, we forecast operating income of 4.67 billion yen. This is significantly higher than the operating income target of 3.2 billion yen set out in our original Management Vision 2026, and is close to the revised target of 4.8 billion yen for the final year of the plan. In addition, net income was 3.33 billion yen, achieving the initial target of 3.2 billion yen ahead of schedule.
Sales are currently at 20.7 billion yen, which is 94 percent of the target, making steady progress.
Achievements from Management Vision 2026
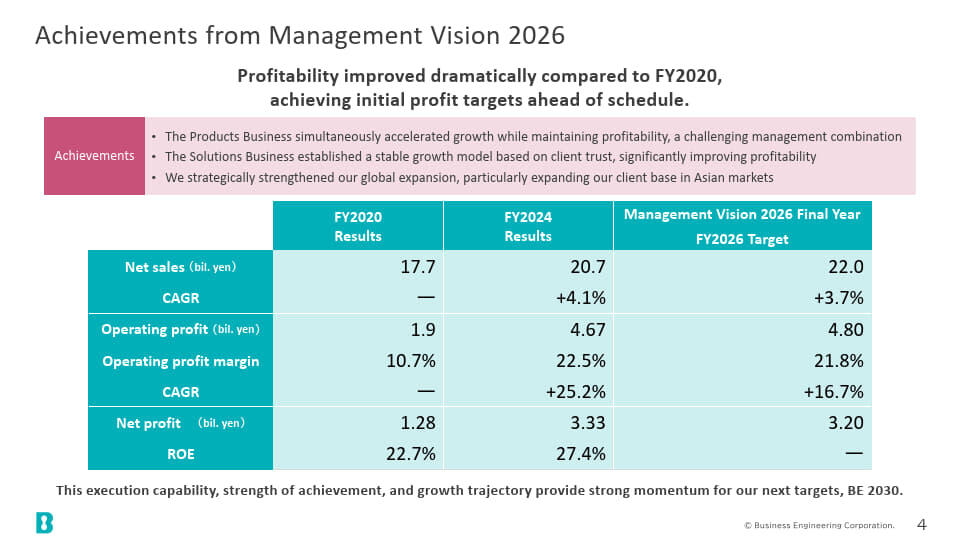
I would like to explain the results we have achieved under Management Vision 2026. As I mentioned earlier, sales have grown from 17.7 billion yen to 20.7 billion yen. Operating profit has also grown by approximately 2.5 times, from 1.9 billion yen to 4.67 billion yen, and the operating profit margin has improved from 10.7% to 22.5%, while ROE has also improved from 22.7% to 27.4%.
We have made great strides in both profitability and capital efficiency, and we believe that this ability to execute, realize, and grow will be a sure driving force toward our next goal, "BE 2030."
BE 2030 | Our Future Vision
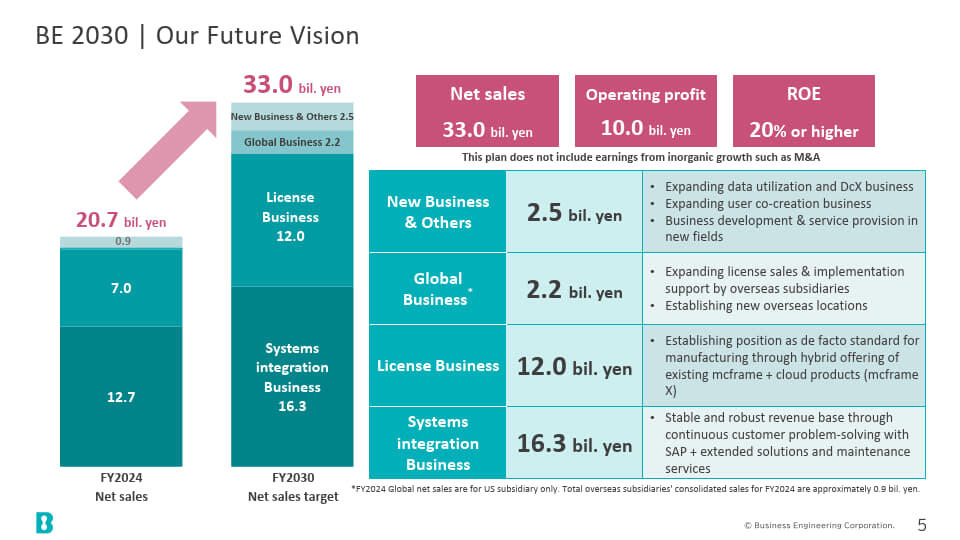
Next, I will explain the vision for B-EN-G under "BE 2030." In terms of numerical targets, we have set sales of 33 billion yen, operating profit of 10 billion yen, and ROE of 20% or more. This plan does not include inorganic growth such as M&A.
I will explain the growth of each business. The system integration business is expected to grow from the current 12.7 billion yen to 16.3 billion yen, and the licensing business from 7 billion yen to 12 billion yen. In the global business, we expect sales of non-consolidated local subsidiaries to grow from approximately 900 million yen to 2.2 billion yen, and new businesses to grow from 900 million yen to 2.5 billion yen.
BE 2030 | Growth Scenario
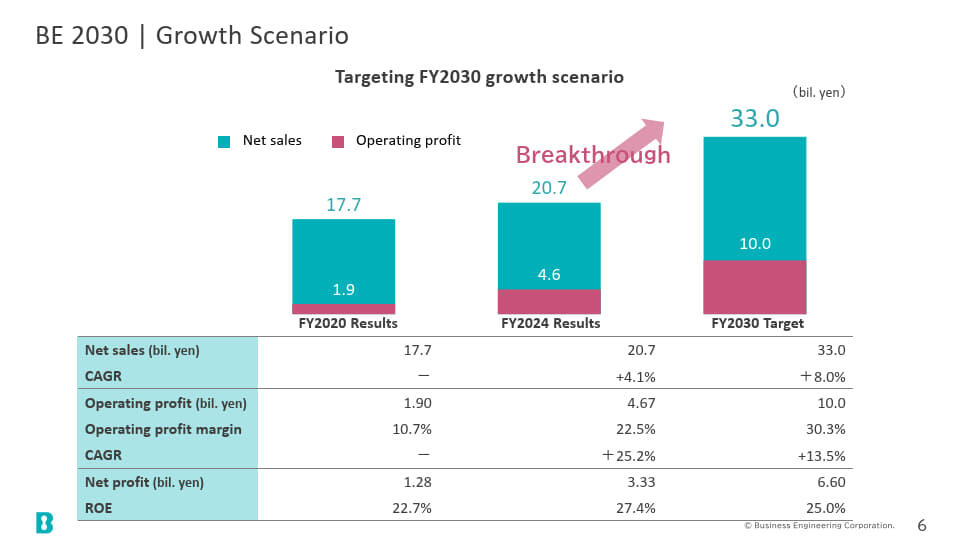
I will now explain our numerical targets in detail. We are expecting sales to grow from 20.7 billion yen to 33 billion yen, a growth of about 1.5 times. We are forecasting an average annual growth rate of 8%.
We expect operating income to double from the current level of 4.67 billion yen to 10 billion yen. The operating income margin will also improve significantly from 22.5 percent to 30.3 percent. We expect net income to double from 3.33 billion yen to 6.6 billion yen.
In addition, ROE will remain at a high level of 25%. This is a growth scenario that will realize significant growth in both sales and profits.
BE 2030 | Growth Scenario
The characteristics of each business are shown as a portfolio. The vertical axis represents growth potential, the horizontal axis represents profitability, and the size of the circle represents the sales amount for each business.
Our Business Model
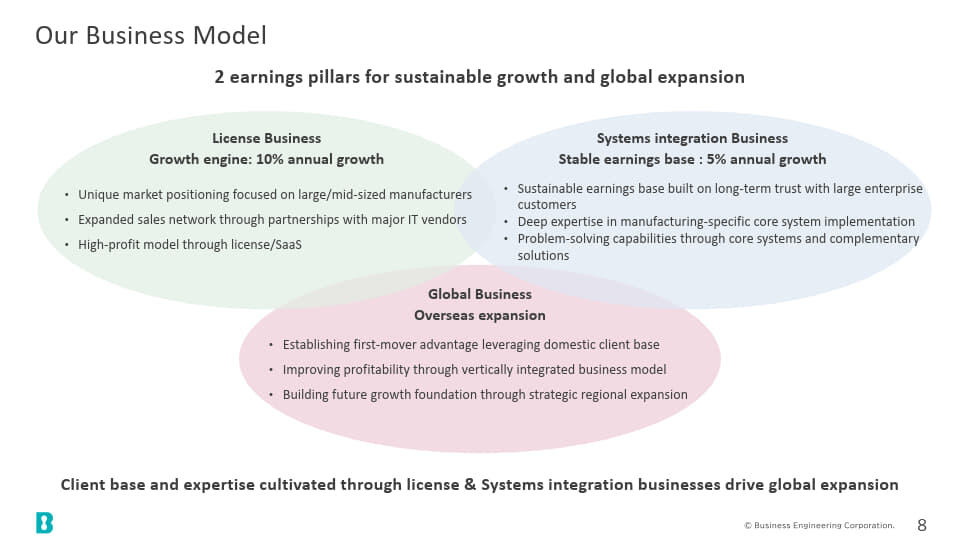
Our business model aims to achieve sustainable growth in our two revenue bases, the licensing business and the system integration business, while further expanding our global business.
Our Business | License Business
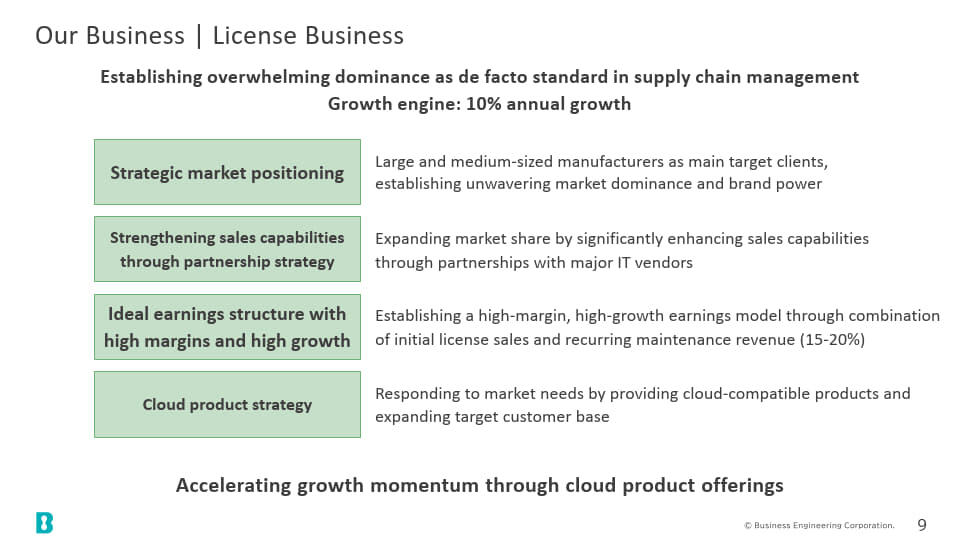
I will explain each of our businesses. First, our licensing business. Our own product, "mcframe," is already establishing itself as the de facto standard in the supply chain management field in the Japanese manufacturing industry. While solidifying this advantage, we expect this to grow at an annual rate of 10% as an engine for the growth of the entire company.
We aim to establish overwhelming dominance and brand power in the market, primarily targeting large and medium-sized manufacturing companies.
Regarding our partnership strategy, we aim to significantly strengthen our sales capabilities and expand our market share by partnering with major IT vendors.
Regarding license sales and license maintenance, we will establish a high-profit, high-growth revenue model through ongoing maintenance revenue.
By bringing cloud products to market, we hope to develop new targets and markets.
Our Business | Systems integration Business
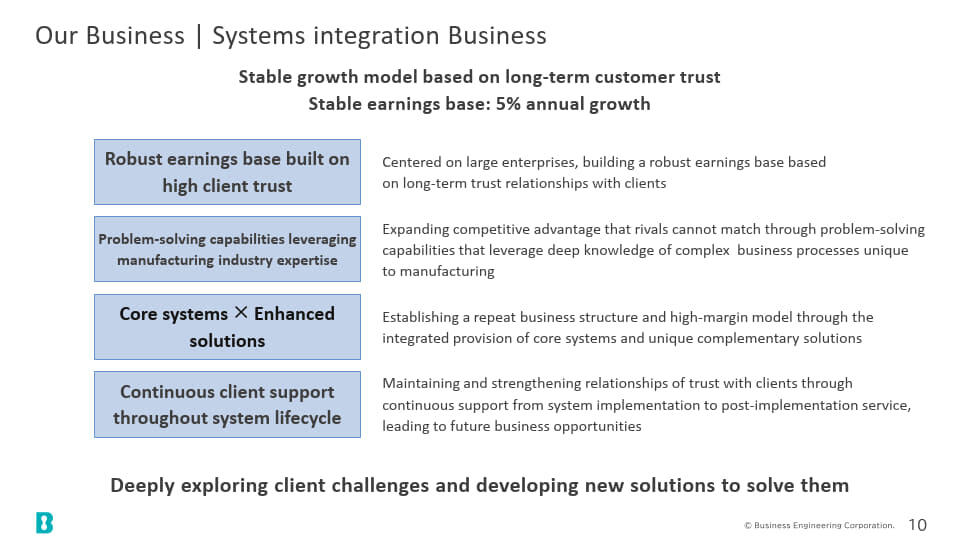
I would like to explain our system integration business. We view the system integration business as a stable growth model based on long-term relationships of trust with customers, and we expect it to grow at an annual rate of 5%.
We have established a strong revenue base based on long-term relationships of trust with our customers, primarily large corporations.
We hope to further expand our advantage, which our competitors cannot match, by leveraging our problem-solving capabilities, which leverage our knowledge of the complex supply chains and business processes that are unique to the manufacturing industry.
By providing a combination of our core system (ERP) and unique complementary solutions, we will establish a repeat business structure and a highly profitable model.
From system implementation to post-implementation support, we provide continuous support to maintain and strengthen relationships of trust with our customers and move forward to the next stage.
By digging deeper into our customers' issues together with them, we will strive to develop new solutions to resolve those issues.
Our Business | Global Expansion
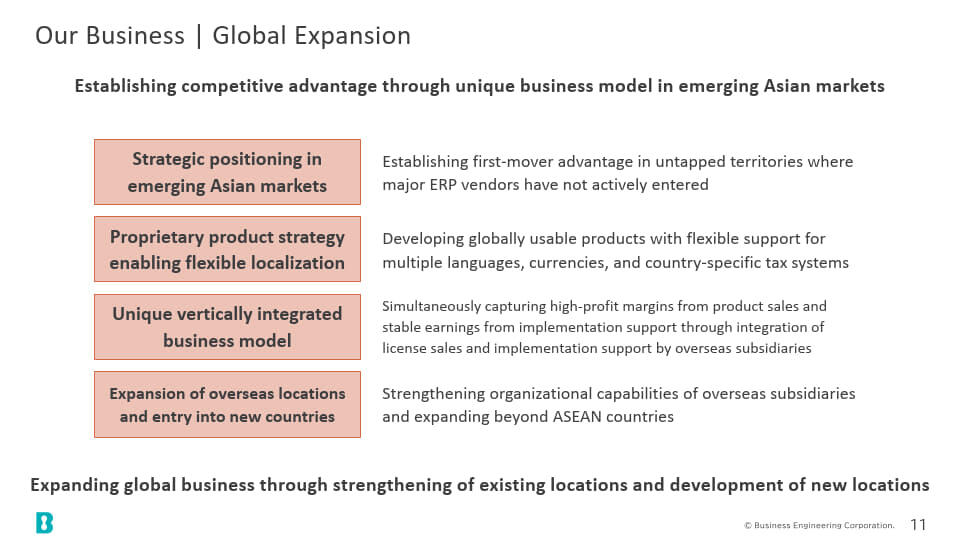
I would like to explain our global expansion.
We believe that we are already establishing an advantage as an early mover in regions, primarily Southeast Asia, where major ERP vendors have not yet made an active entry.
We currently offer products that can be used globally, in multiple languages, multiple currencies, and with flexible support for each country's tax system.
By integrating license sales and implementation support through our local subsidiary and through our vertically integrated business model, we are able to simultaneously achieve high and stable profits.
We would like to further expand our global business by expanding our organization through overseas local subsidiaries and alliance partners, and by expanding into countries outside of ASEAN.
Our Business | New Business Development
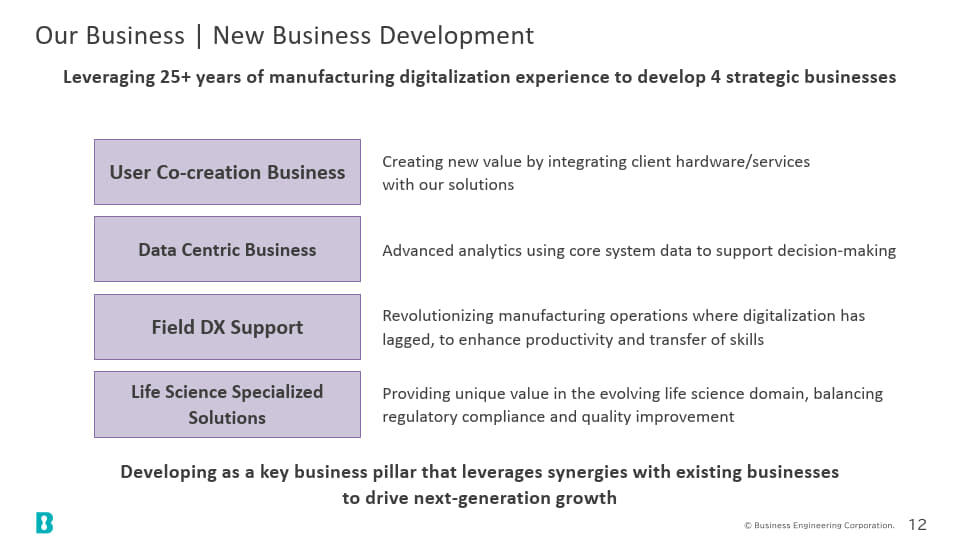
Finally, I would like to talk about new businesses. We plan to develop new businesses in the following four areas.
The first is a user co-creation business, in which we combine our software with our customers' hardware and services to create new business models and added value.
The second is our data-centric business. We would like to further expand services that support our customers' decision-making by utilizing the data accumulated in our core systems.
The third is support for field digital transformation. We will promote digitalization in manufacturing operations, where digitalization has lagged behind, and expand our business in this area.
And the fourth is to provide solutions specialized in the life sciences field. We believe that the life sciences field will see significant evolution and development in the future, and we will expand our products and services aimed at complying with regulations and improving quality.
In these four areas, we hope to develop business pillars that will drive growth in the next generation.
Capital Allocation
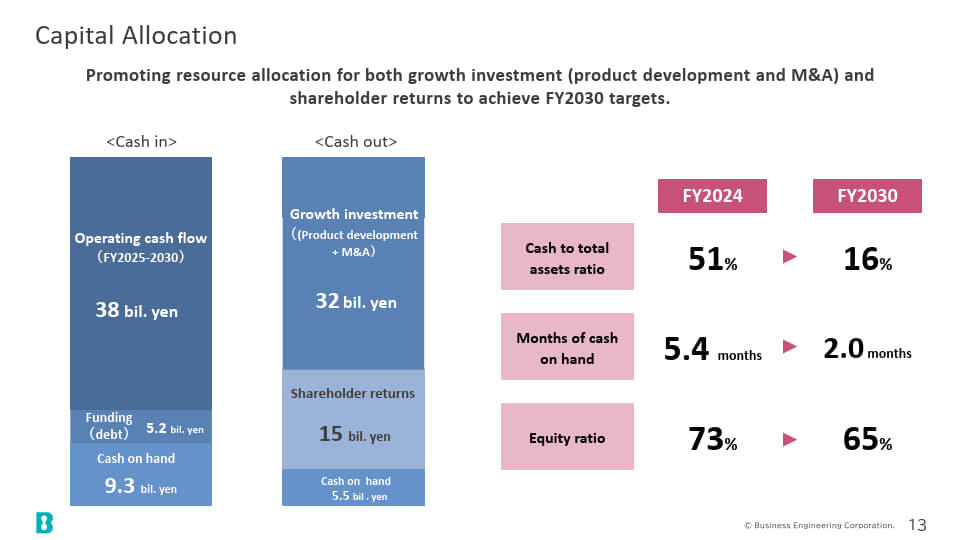
I would like to explain our capital allocation. To achieve our targets for fiscal 2030, we will promote the allocation of management resources to both investments for growth (investment in product development, M&A) and shareholder returns.
The bar graph on the left shows the breakdown of cash in and cash out. The ratio of cash and deposits to total assets will be 51% in fiscal 2024, but is expected to be 16% in fiscal 2030. The number of months of sales for cash on hand will decrease from 5.4 months to 2 months, and the equity ratio is expected to decrease from 73% to 65%.
Shareholder Returns
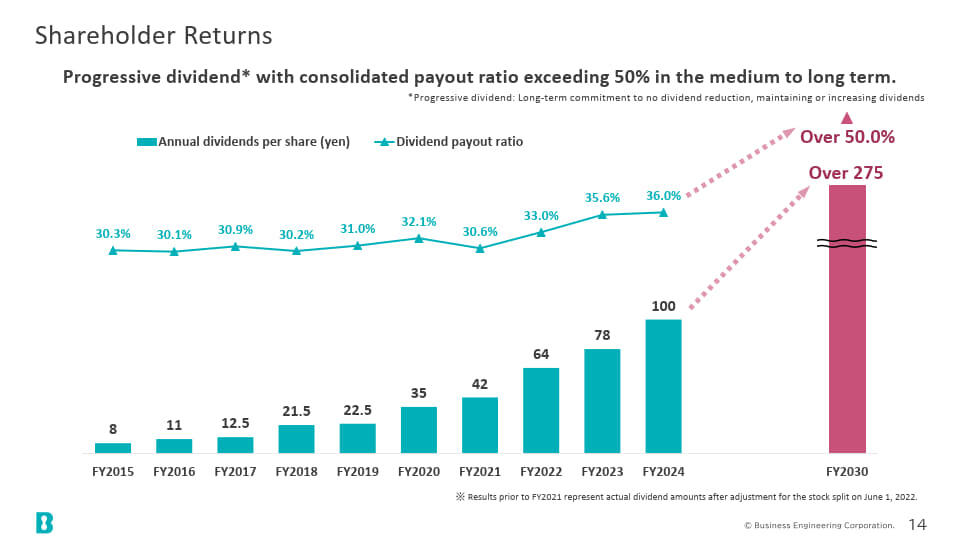
I would like to explain shareholder returns. Currently, our basic policy is to strive to maintain a progressive dividend and dividend payout ratio of more than 35% over the medium to long term, but from fiscal 2025 onwards, we would like to increase the dividend payout ratio to more than 50%.
Financial Policy and M&A Policy
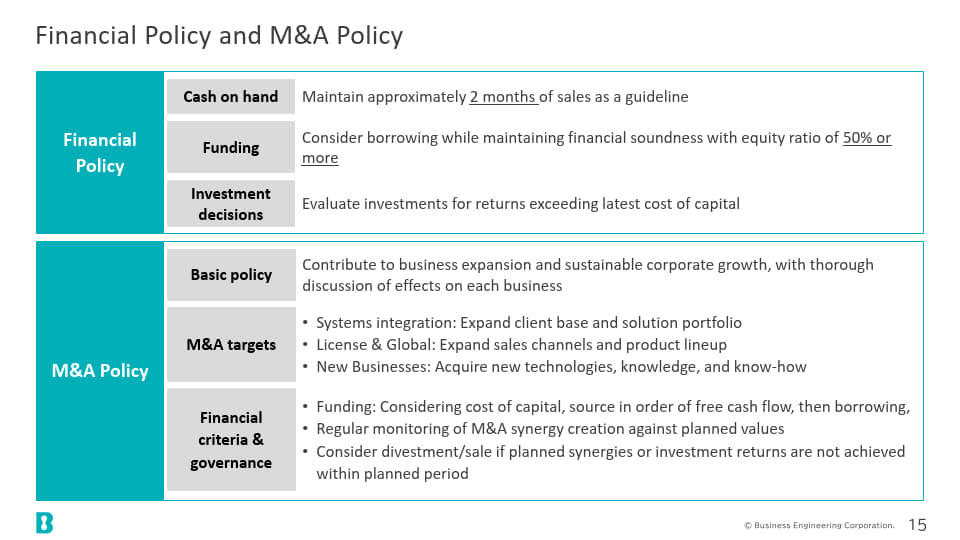
Regarding financial and M&A policies, we plan to consider M&A in particular with companies related to our business.
Capital Cost-Conscious Management
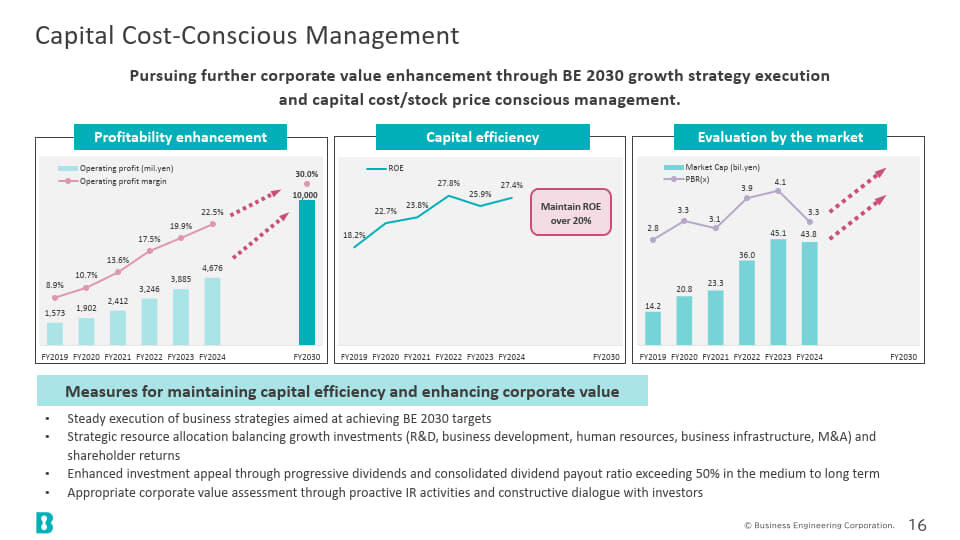
We will continue to promote management that takes into account capital costs and stock prices, and strive to improve profitability, capital efficiency, and market evaluation. We also intend to further strengthen measures to maintain capital profitability and increase corporate value.
This concludes my explanation of "BE 2030," our growth strategy and vision for 2030. Thank you very much.
Q&A (Summary) #1
Q: Are sales of cross-shareholdings included as special profits?
A: We expect special profits of over 200 million yen in the first half of the year.
Q&A (Summary) #2
Q: Your performance forecast for the first and second halves of fiscal 2025 is almost half. What is the reason for this?
A: In the past, there was variation between the first and second halves of the year, but this fiscal year, we are now able to see the figures for the first half, and if we were to make an accumulated forecast, the figure is roughly half of what we had in mind.
Q&A (Summary) #3
Q: Could you please tell us if there are any trends regarding the client base of the Solutions and Products businesses this fiscal year? Also, what is the ratio of ERP to other solutions?
A: In the past, there were increases in the food and pharmaceutical sectors during the COVID-19 pandemic, followed by increases in the electrical and electronics sectors. However, this fiscal year, the composition ratio for both businesses has remained stable, without bias towards any particular industry.
In the solutions business, 40% is ERP-related and 60% is peripheral expansion solutions.
Q&A (Summary) #4
Q: What is the breakdown of your product development investment? Also, will the development resources be in-house or outsourced?
A: Mainly in-house. The breakdown is the development of feature extensions for "mcframe" and SaaS.
Q&A (summary) #5
Q: Are you being affected by the Trump tariffs? How do you foresee their impact on your clients?
A: We do not believe that the direct impact on our company will be that great, but we believe that the impact will be greater for our clients in their industries, so we will continue to closely monitor developments and respond appropriately.
Q&A (Summary) #6
Q: Your operating profit margin target for fiscal 2030 is 30.3 percent. Is this achievable?
A: Operating profit margins vary depending on the business model, and we believe that it is not easy to achieve this level through system integration alone. However, we expect that growth in license sales as a licensor will contribute to improving profit margins.
Q&A (Summary) #7
Q: Your target for fiscal 2030 is 10 billion yen in operating profit, but how do you envision growing to reach this figure? Is it linear, or not?
A: Our growth forecast basically assumes a linear growth trend, however, with the development of the "mcframe" SaaS product, we expect the slope of the growth curve to increase in the latter half of the planning period.
Specifically, we expect to maintain a stable growth rate from the early to mid-term, while realizing accelerated growth in the later period, ultimately achieving our target figures.
Q&A (Summary) #8
Q: I have a question about the 5% annual growth rate of the system integration business. I understand that the utilization rate is already high, but are there any concerns about resources (mainly personnel)?
A: Basically, the resource issue is expected to be overcome by the following three measures.
First, we will increase employee engagement by investing in our people for the future, improving working conditions and providing education.
Second, we have made minor investments in the solutions business to secure personnel, and will continue to do so.
Third, we will actively recruit employees who resonate with us by highlighting B-EN-G's unique management style, which specializes in manufacturing, has its own products, and is leading the promotion of digital transformation globally, for both new graduates and mid-career hires.
Q&A (Summary) #9
Q: You said that you will increase the global sales from 900 million yen to 2.2 billion yen in fiscal 2024, but when do you plan to include it in your consolidation? Also, if it is included in your consolidation, will it be a factor that pushes down or up profits?
A: At present, only our US subsidiary is consolidated, but we are considering consolidating all overseas subsidiaries in fiscal 2026. If consolidated, this is expected to boost our performance, but we believe that this will result in a slight decrease in our operating profit margin.
