Supply chain visualization and optimization solutionAsprova SCP
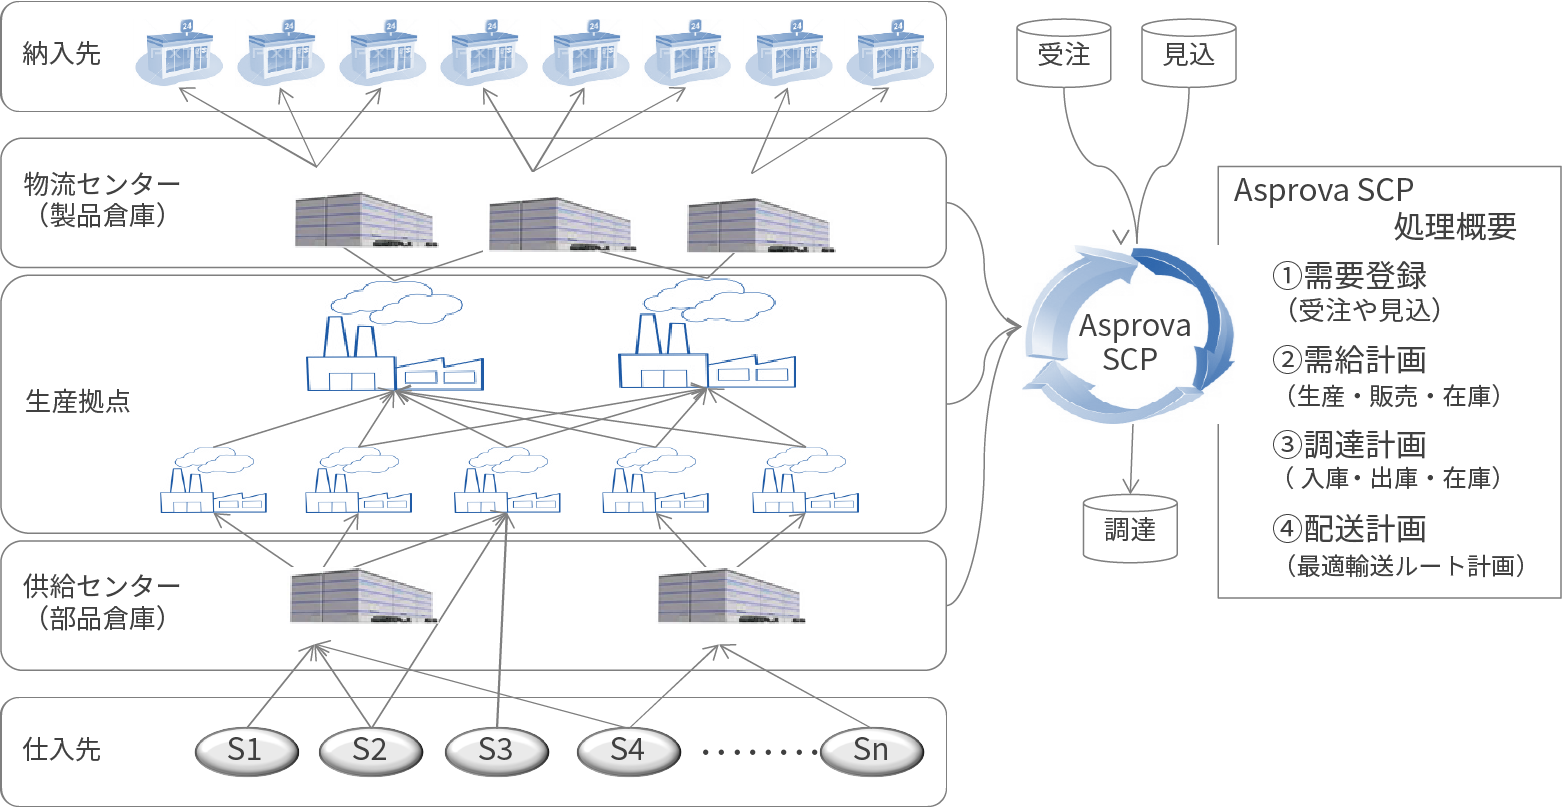
Asprova SCP is a solution that visualizes and optimizes the supply chain across multiple production plants, multiple logistics bases, and multiple suppliers.
By registering final demand such as orders and forecasts, the system calculates the optimal inventory placement at each location, while also planning optimal transportation routes and visually visualizing the entire supply chain.
Overview
Supply chain bases are defined as delivery points, distribution centers, production bases (own factories or subcontractors), parts warehouses, suppliers, etc. The optimal transportation route is planned by considering the transportation method (truck, sea, air, etc.) between these bases, the load status of the bottleneck process at the production bases, inventory status at the stock points, etc.
Features
- Realizing optimal transportation routes and production allocation Planning of production distribution to production sites is achieved while taking into account optimal transportation routes and inventory conditions.
- Integration with production scheduler for each factory It can also be linked with the factory production scheduler "Asprova APS," allowing for the creation of an overall supply chain plan that takes into account the results of detailed scheduling at production sites.
- Full of charts for visualization Easily create tables and charts that are easy to visualize, such as supply and demand tables (PSI tables), resource Gantt charts, order Gantt charts, inventory graphs, and load graphs.
Benefits
- Shortening supply chain lead time Supply chain planning that takes into account optimal transportation routes and production capacity can shorten the lead time of the entire supply chain.
- Inventory reduction through proper inventory placement Optimal supply chain planning makes it possible to properly allocate inventory at each location. Proper placement will reduce excess inventory and prevent understock.
- Speed up decision-making through supply chain visualization Various charts such as supply and demand tables, inventory graphs, load graphs, order Gantt charts, and resource Gantt charts make it easier to understand the situation and speed up decision-making by visualizing the causes of delivery delays and bottlenecks.
- KPI to evaluate multiple scenarios Multiple planning scenarios are evaluated with pre-defined KPIs to evaluate each one and help speed up the decision-making process.
- Realization of transferable planning tasks Planning work is one of the most difficult tasks to hand over in the manufacturing industry. In order to ensure smooth handover of such planning operations, we develop planning flows and constraints, and support systematization of logic.
- Achieving speedy response to changing circumstances Even if the planning method changes due to changes in business conditions, Asprova SCP is a highly versatile system that can reflect requirement changes without development. This allows for early response to requirement changes and enables decision-making without delay.
B-EN-G implementation support
When one person is working on Microsoft® Excel and using a thought-processing approach, if we try to systemize the current approach as it is, we will end up with an individualized scheduling system, which will not solve the problem.
At B-EN-G, consultants who are familiar with the characteristics of these planning operations begin by supporting business improvements.
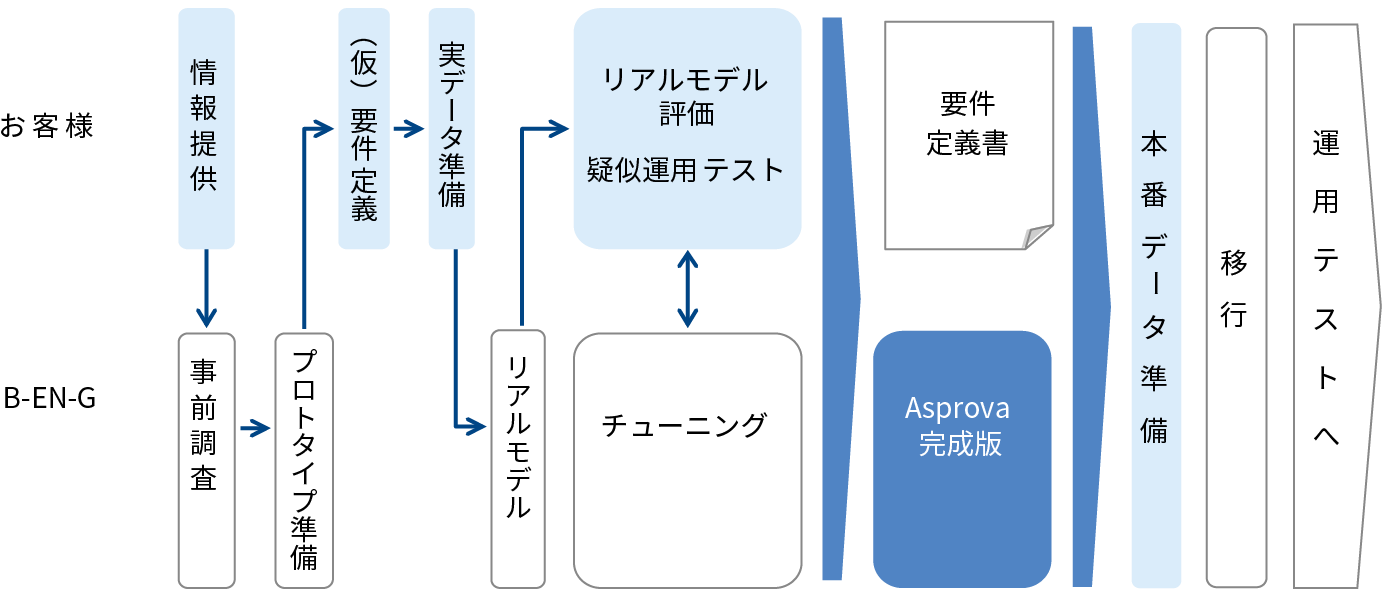
At B-EN-G, we prepare a realistic model in about a month by incorporating master data (basically all records) and planning data (planning period) used in actual operations into a prototype created after a brief interview. This model allows us to proceed with requirements review in a simulated operational test manner, preventing requirements from being overlooked.