

Fiscal Year 2025 3Q Financial Results Briefing - Transcript (Including Q&A Session)
The briefing presentation content is posted below in both text and slide images.
Executive Summary of FY2025 3Q Financial Results
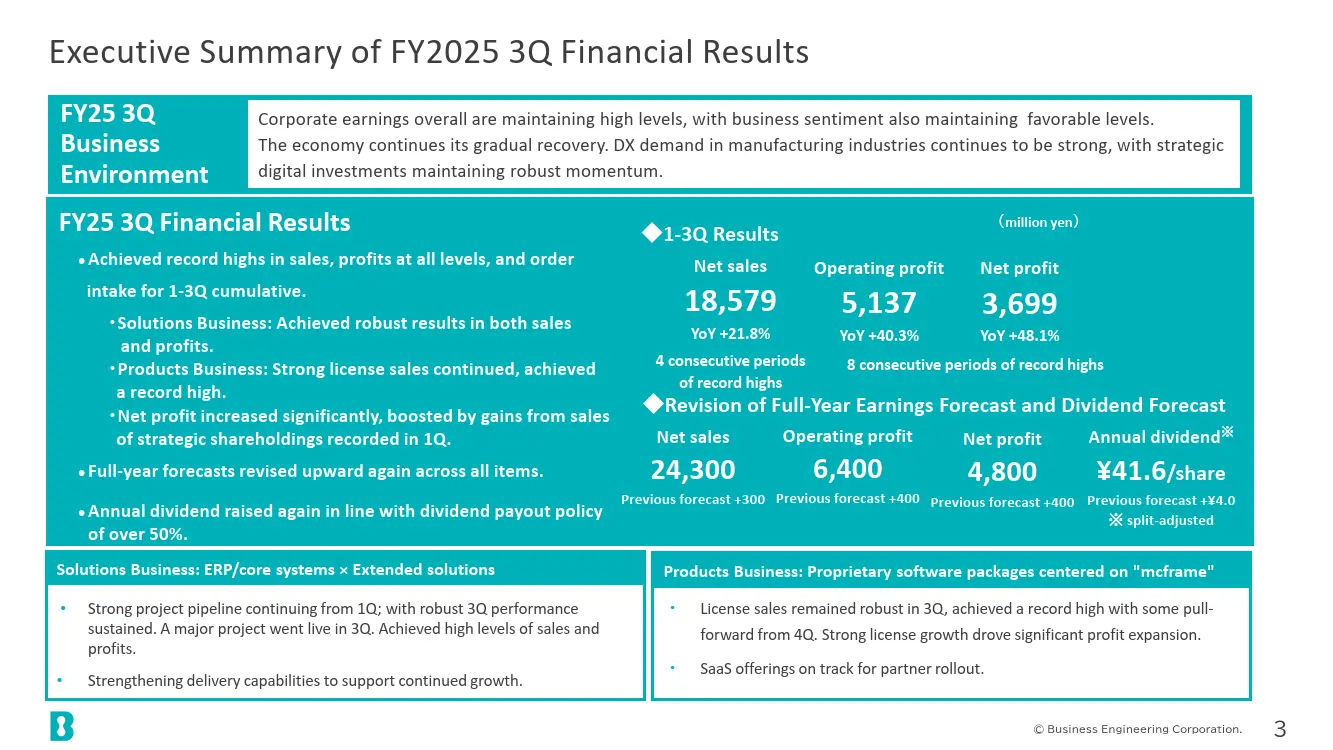
My name is Shigeaki Betsuno, CFO of Business Engineering Corporation. I will begin by explaining our financial results for the third quarter of FY2025.
Let me start with an overview of the quarter. Following solid performances in 1Q and the first half, we also delivered strong results in 3Q.
Net sales increased 21.8% year on year to 18,579 million yen, operating profit rose 40.3% to 5,137 million yen, and net profit grew 48.1% to 3,699 million yen. We have therefore achieved consecutive record highs.
Both the Solutions Business and the Products Business delivered high levels of sales and profit. In addition, net profit increased significantly, partly reflecting gains from the sale of strategic shareholdings recorded in 1Q.
Based on this performance, we have revised our full-year earnings forecast upward once again. We now forecast net sales of 24,300 million yen, operating profit of 6,400 million yen, and net profit of 4,800 million yen. In line with our dividend payout policy of over 50%, we also plan to increase the annual dividend by 4 yen to 41.6 yen per share on a split-adjusted basis. I will provide further details shortly.
Summary of Consolidated Income Statement
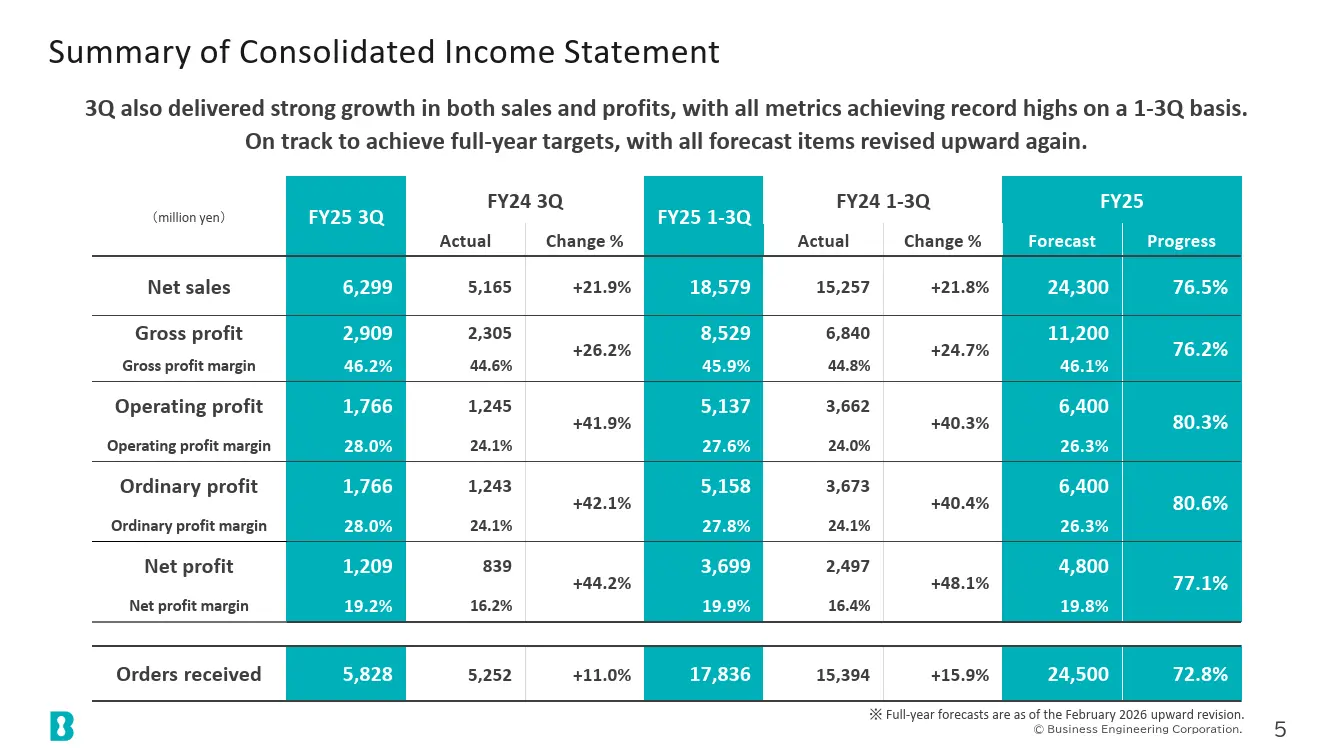
These are the highlights of the consolidated income statement. Both 3Q and the cumulative 1?3Q results recorded substantial growth in net sales and profits.
Net sales increased by more than 20% year on year in both 3Q and on a cumulative 1?3Q basis. Operating profit also increased by more than 40% year on year in both periods. Orders received rose by more than 10% year on year in both 3Q and on a cumulative basis, reflecting significant growth.
Progress against the revised forecast is also proceeding steadily.
Progress Against Full-Year Sales Forecast
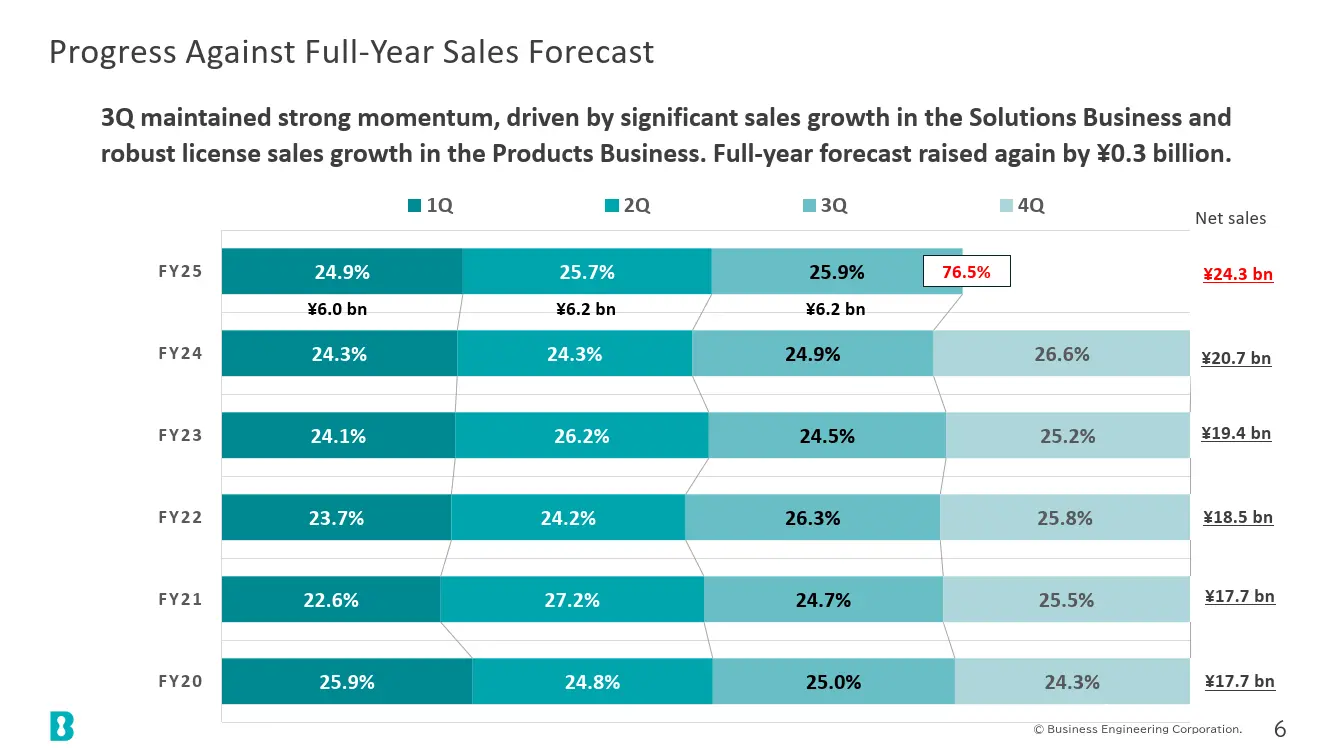
This section shows progress against the full-year net sales forecast. Against the revised forecast of 24,300 million yen, which was raised by 300 million yen, progress stands at 76.5%.
Progress Against Full-Year Operating Profit Forecast
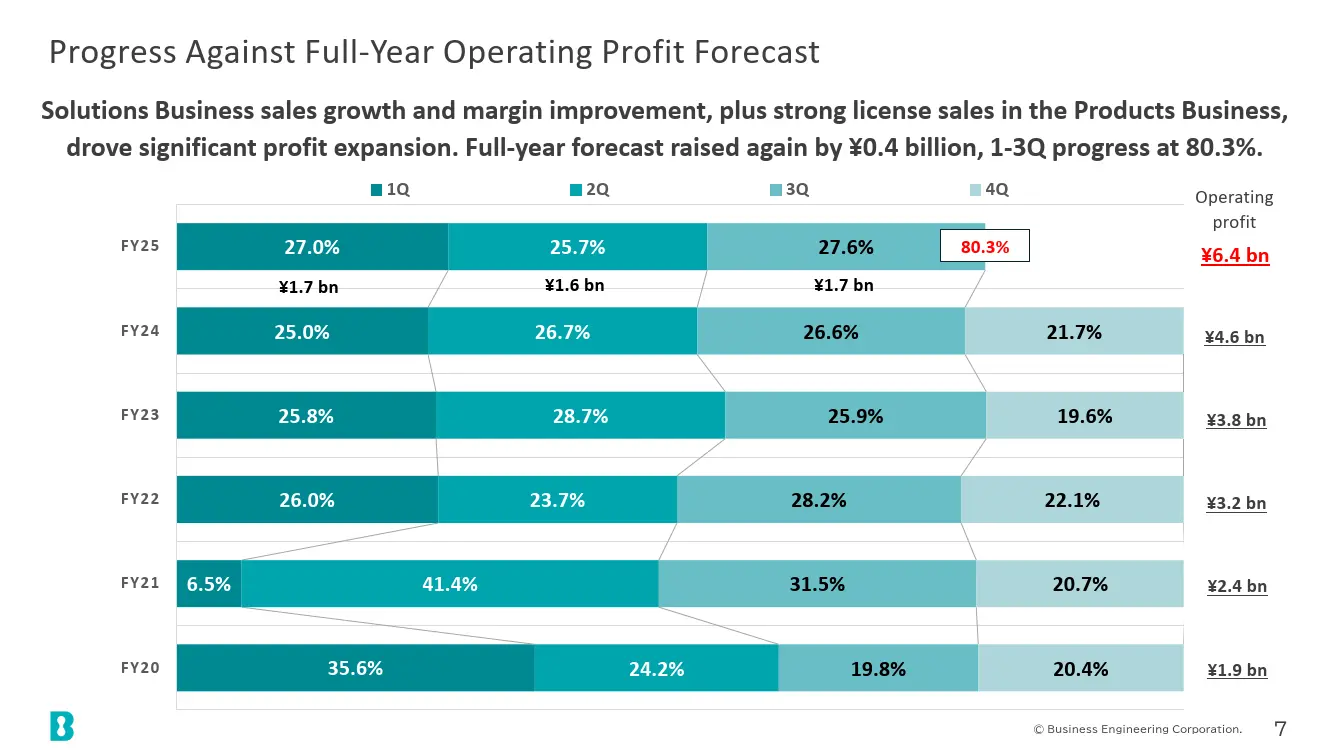
This section shows progress against the full-year operating profit forecast. Against the revised forecast of 6,400 million yen, which was increased by 400 million yen, progress stands at 80.3%.
Analysis of Changes in Operating Profit (YoY)
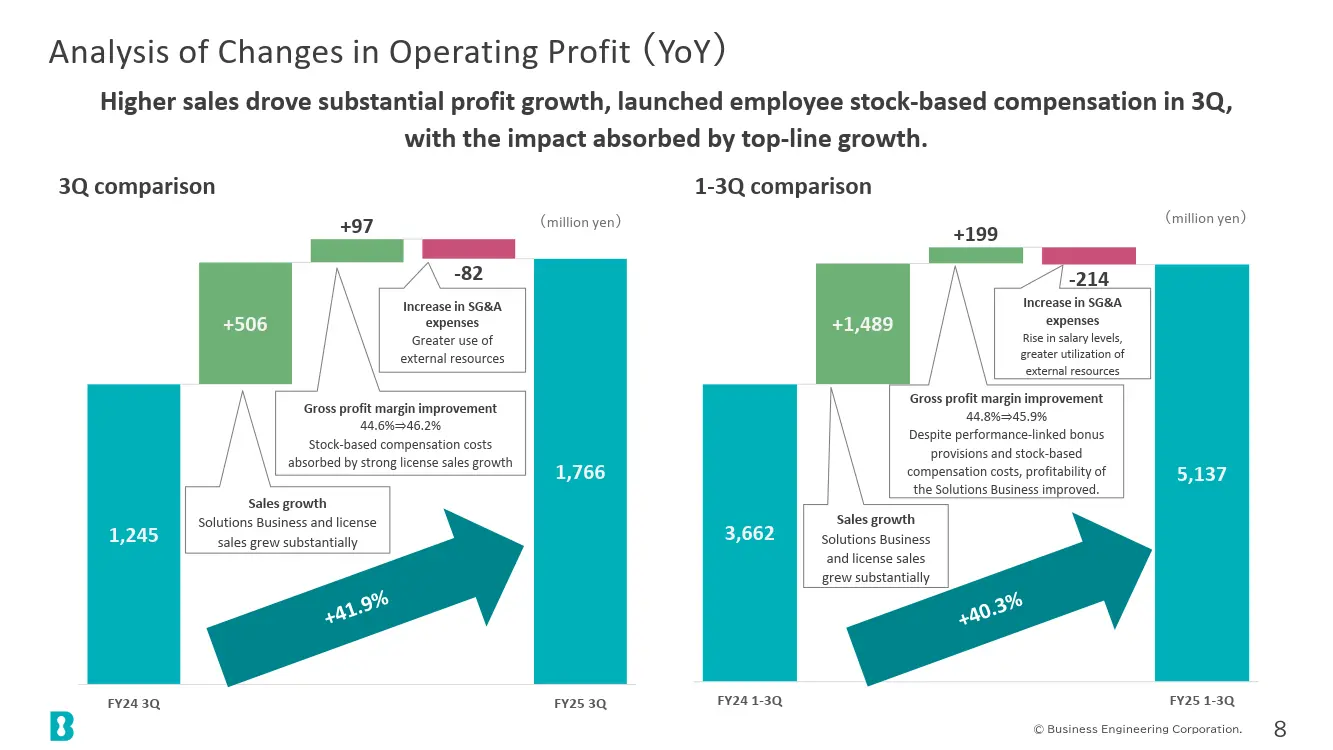
This section provides an analysis of changes in operating profit. In both 3Q and on a cumulative 1?3Q basis, increased net sales drove significant growth in operating profit. Although costs increased due to the introduction of employee stock compensation starting in 3Q, this was absorbed, and the gross profit margin improved in both periods.
Sales & Operating Profit by Segment
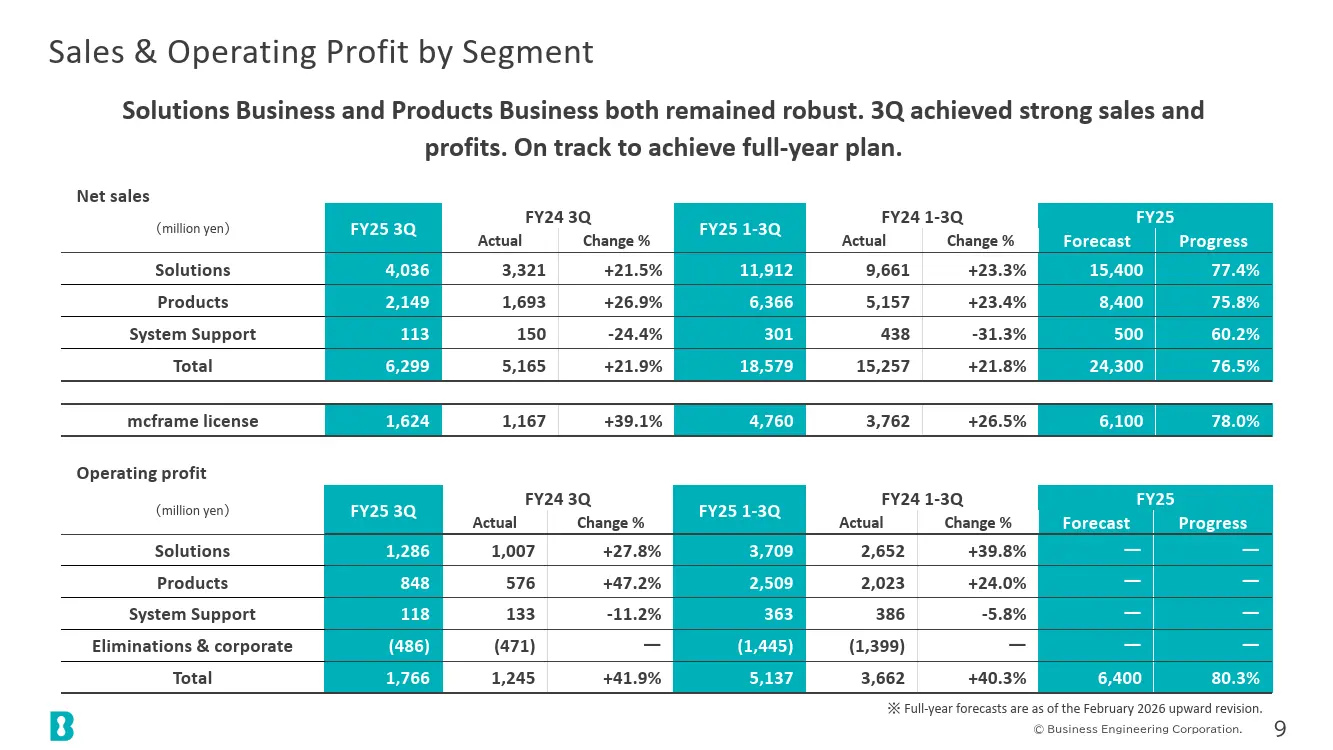
This section shows net sales and operating profit by segment. Both the Solutions Business and the Products Business recorded high growth rates in both 3Q and on a cumulative 1?3Q basis.
In terms of net sales, the Solutions Business grew by more than 20% year on year in both 3Q and on a cumulative basis, and the Products Business also recorded growth of more than 20% year on year in both periods.
In terms of operating profit, the Solutions Business achieved strong growth of nearly 40% year on year on a cumulative 1?3Q basis. The Products Business recorded a 47% year-on-year increase in 3Q and a 24% increase on a cumulative basis, also achieving substantial profit growth.
Segment Information: Solutions Business
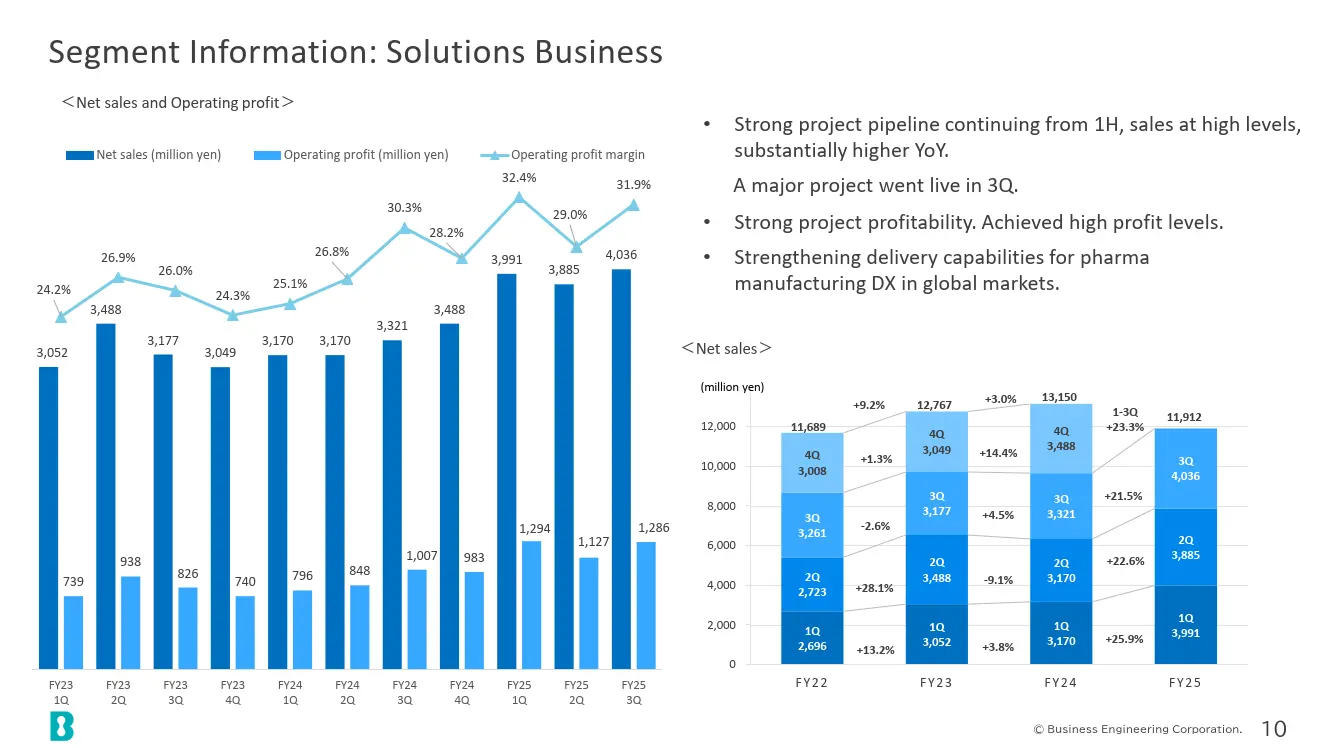
This section provides segment information. The Solutions Business achieved a high level of net sales from 1Q through 3Q.
In terms of profitability, it has maintained a high level exceeding approximately 30%. Although it may appear to have declined slightly in 2Q due to the impact of performance-linked bonuses, in reality it secured a profit margin of over 30%.
In 3Q, part of a major project went live. In addition, as part of our initiatives, we are strengthening our solution delivery structure to support DX in the global pharmaceutical manufacturing market.
Segment Information: Products Business
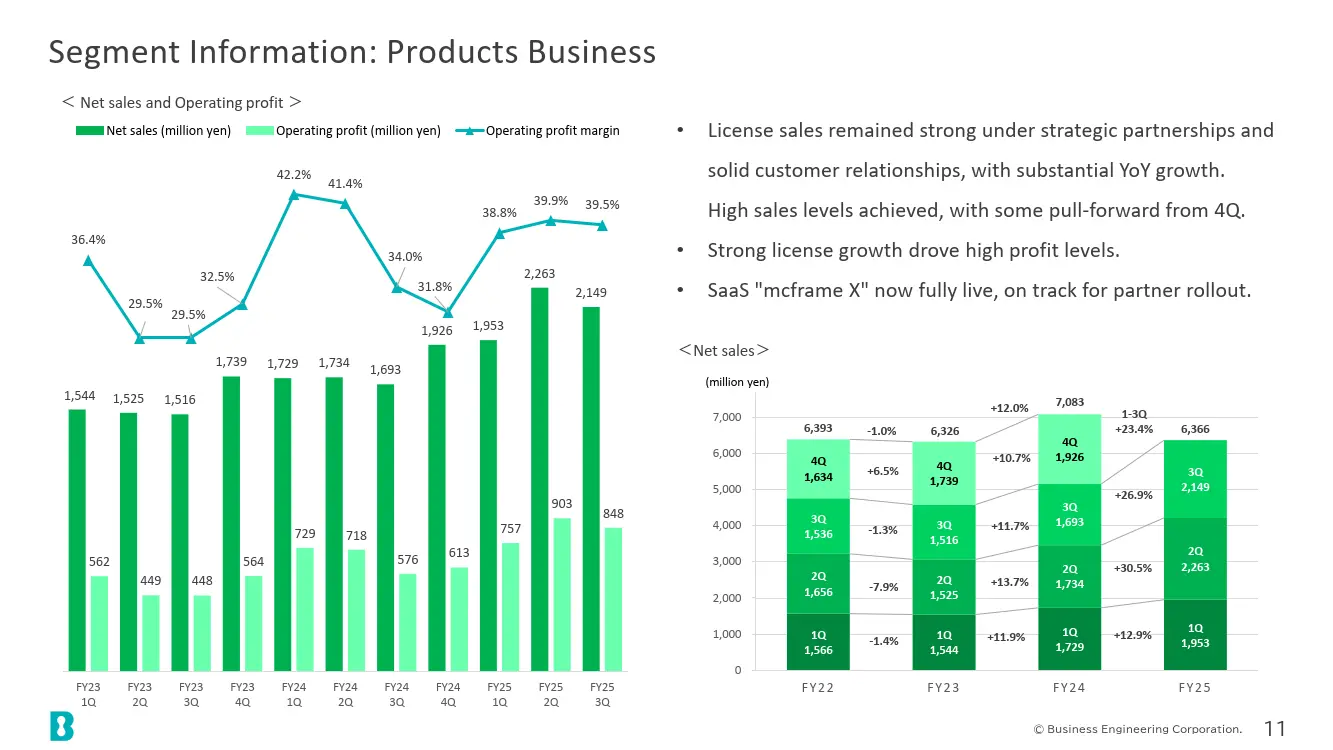
In the Products Business, we achieved high levels of net sales in both 2Q and 3Q. The profit margin has also been maintained at a stable level of approximately 40%. Net sales in 3Q reached a high level partly due to pull-forward from 4Q.
In addition, SaaS-based "mcframe X" has begun full-scale operations, and we are making steady progress toward partner rollout.
mcframe License Sales
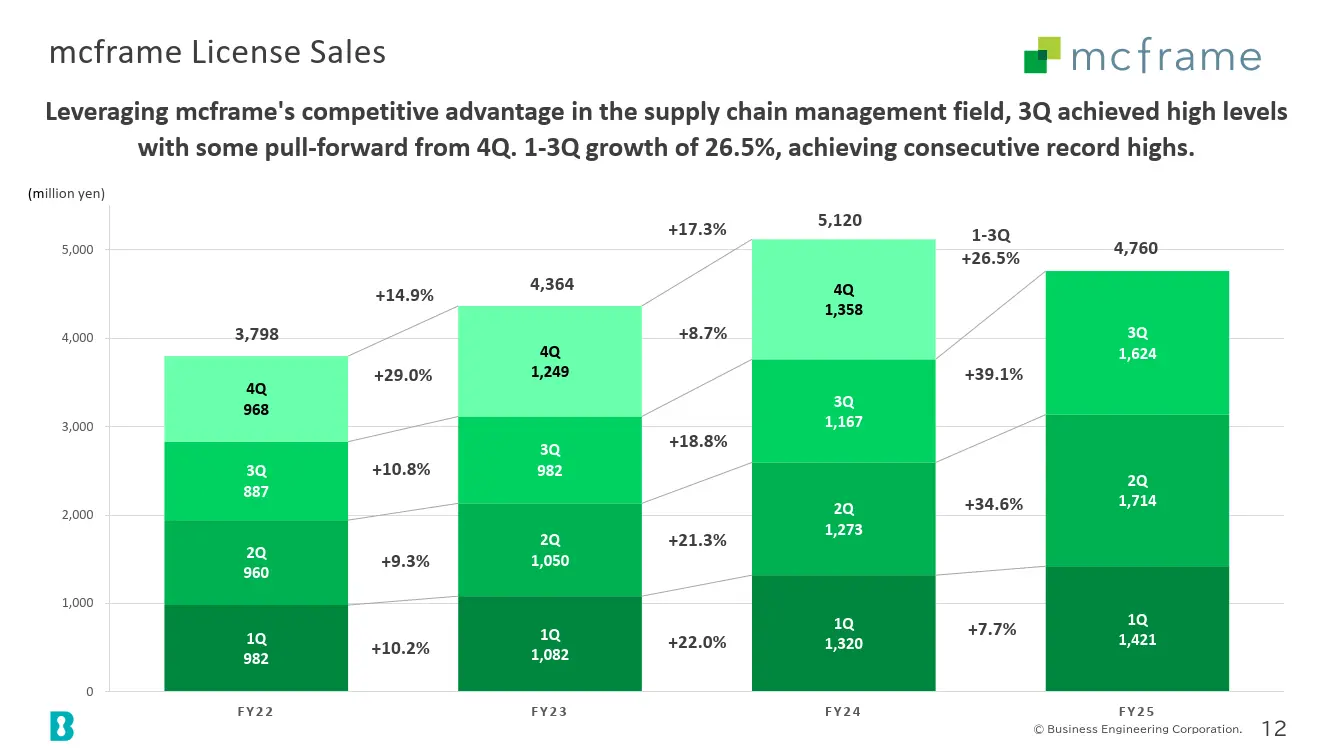
This slide shows trends in mcframe license sales. In 3Q, partly due to pull-forward from 4Q, we achieved a high level of sales. Net sales amounted to 1,624 million yen. The cumulative growth rate reached 26.5%, representing a notably high level of growth.
Summary of Consolidated Balance Sheet
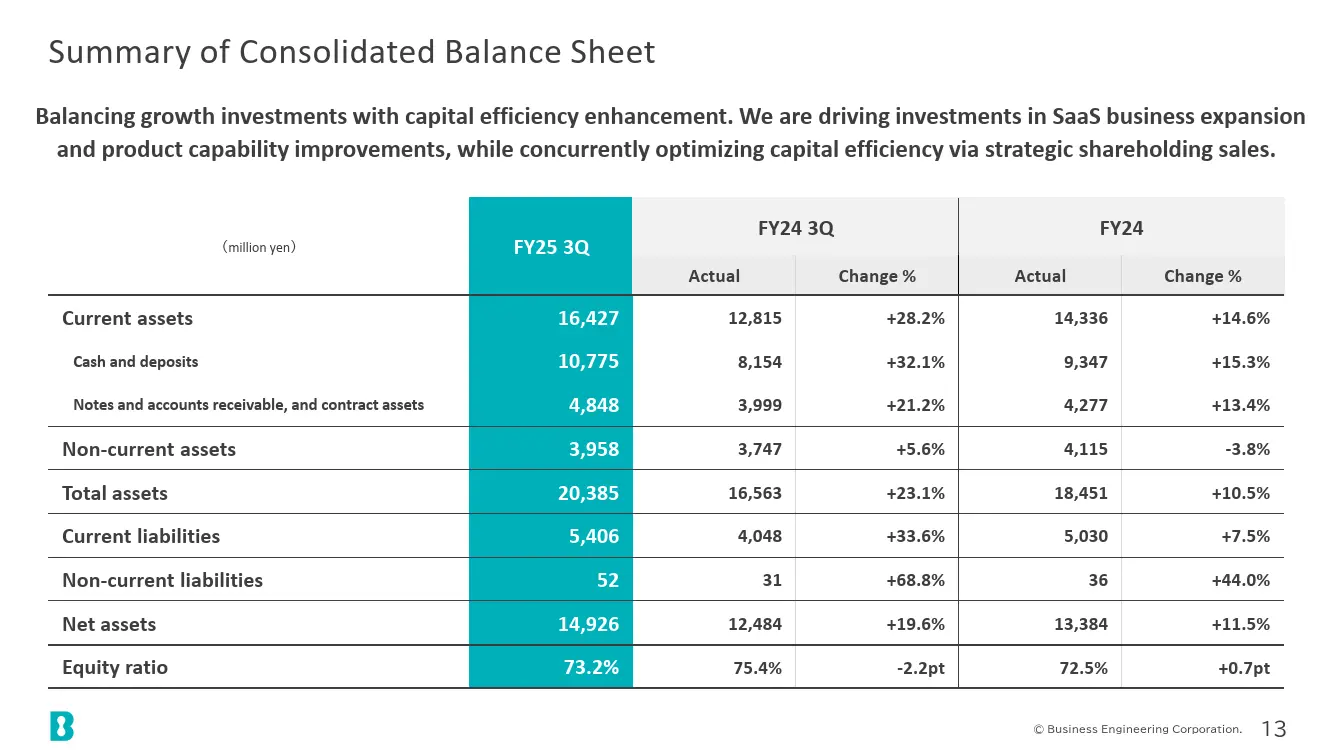
Next is the balance sheet. Total assets at the end of 3Q were approximately 20.0 billion yen, and net assets were approximately 15.0 billion yen, representing an increase of more than 10% compared with the end of the previous fiscal year.
Only non-current assets decreased compared with the end of the previous fiscal year. This was because, although intangible assets (software) increased due to product development investment, the decrease resulting from the sale of strategic shareholdings exceeded that increase. This decline is a one-time decrease limited to this fiscal year.
Executive Summary of FY2025 Earnings Forecast
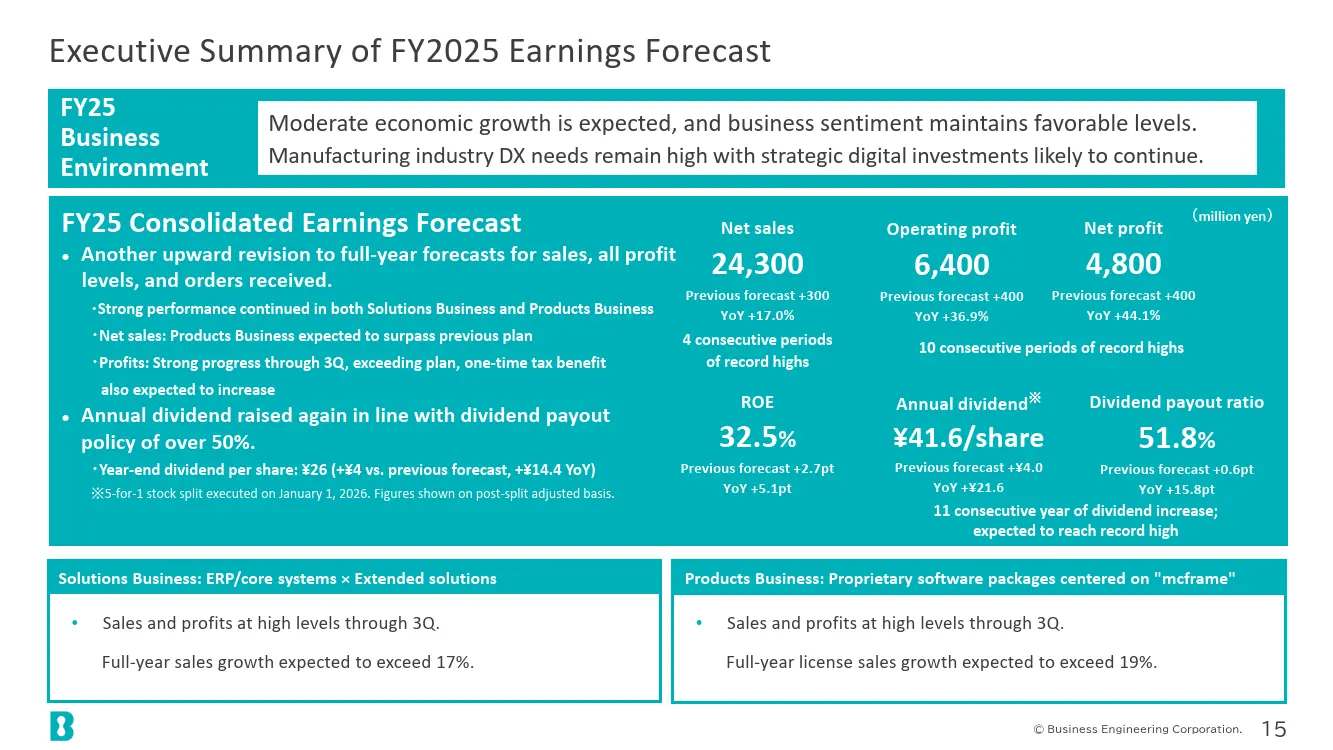
Next, I will explain the full-year earnings forecast. As mentioned earlier, we forecast net sales of 24,300 million yen, operating profit of 6,400 million yen, and net profit of 4,800 million yen.
Both businesses continue to perform well. Net sales in the Products Business are expected to exceed the previous plan. In addition, we expect an increase in one-time tax burden reductions, which has been incorporated into net profit.
Regarding dividends, in line with our policy of maintaining a dividend payout ratio of over 50%, we will again increase the annual dividend. The annual dividend will be increased by 4 yen to 41.6 yen per share. The projected dividend payout ratio at that time is 51.8%.
ROE is also expected to reach 32.5%, representing an improvement of 2.7 percentage points from the previous forecast.
Earnings Forecast
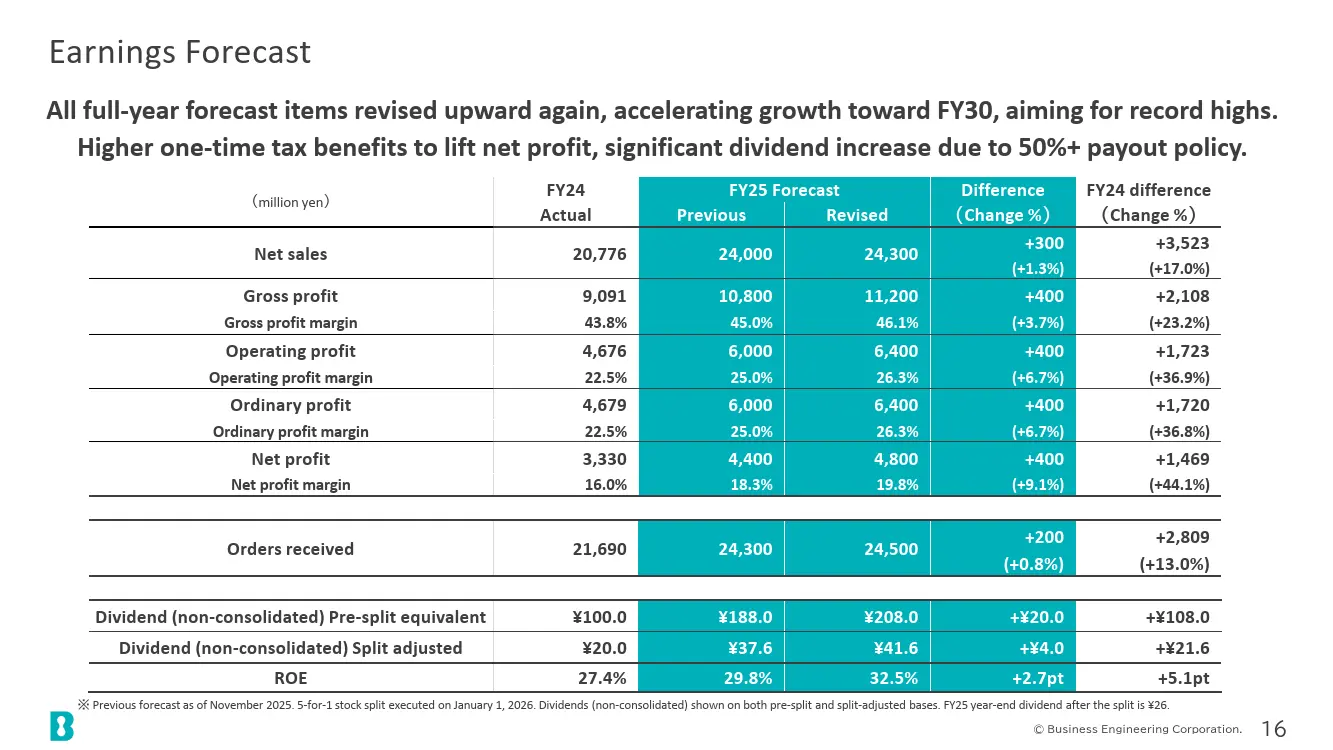
This section provides a breakdown of the earnings forecast. Gross profit, which was not mentioned earlier, has also been increased by 400 million yen from the previous forecast, in line with the increase in operating profit. Orders received have been increased by 200 million yen from the previous forecast, and are expected to reach 24,500 million yen.
Segment & mcframe License Sales Forecasts (FY)
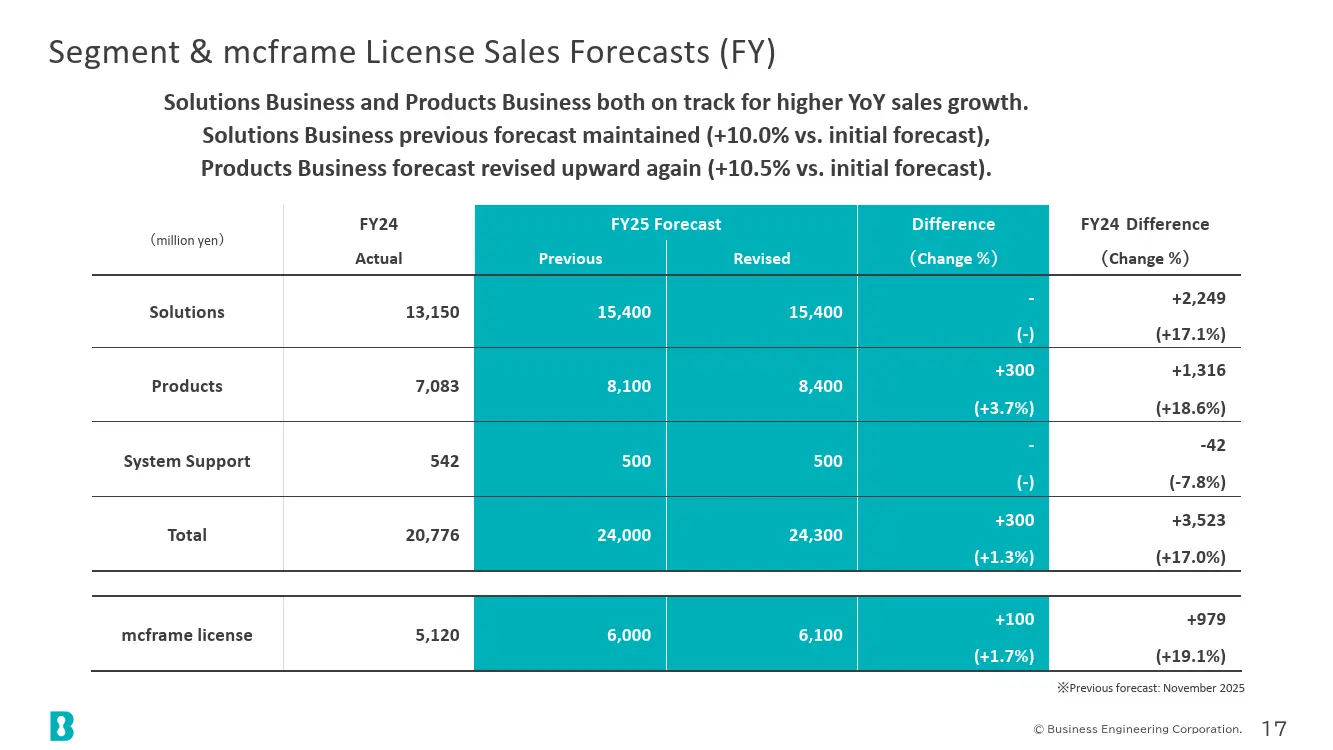
This section shows the full-year sales forecasts by segment. There is no change to the Solutions Business forecast from the previous forecast. The Products Business forecast has been increased by 300 million yen from the previous forecast, and is expected to reach 8,400 million yen. In addition, mcframe license sales have been increased by 100 million yen from the previous forecast, and are expected to reach 6,100 million yen.
Although there is no change to the Solutions Business forecast in this revision, at the time of the previous plan it had already been increased by 10% compared with the initial forecast. With the additional 300 million yen increase in the Products Business in this revision, it represents a 10.5% increase from the initial forecast, meaning that both businesses have been significantly increased compared with the initial forecast.
Solutions Business Forecast
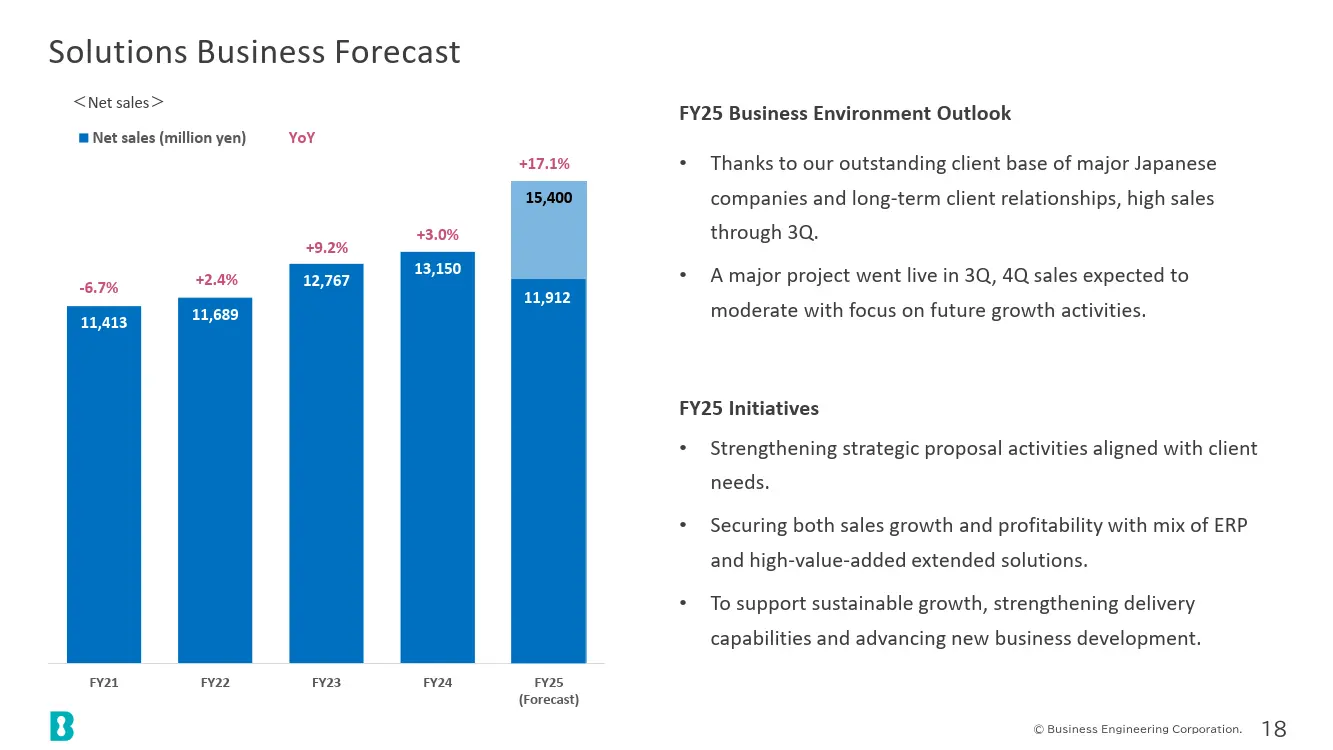
This section outlines the forecast for the Solutions Business. Net sales are expected to reach 15,400 million yen, representing a 17.1% increase year on year. In 3Q, part of a major project went live, and in 4Q, due to strengthened activities aimed at future growth, net sales are expected to stabilize.
As part of our initiatives, we are promoting the strengthening of our solution delivery structure and the development of new businesses in order to achieve sustained growth.
Products Business Forecast
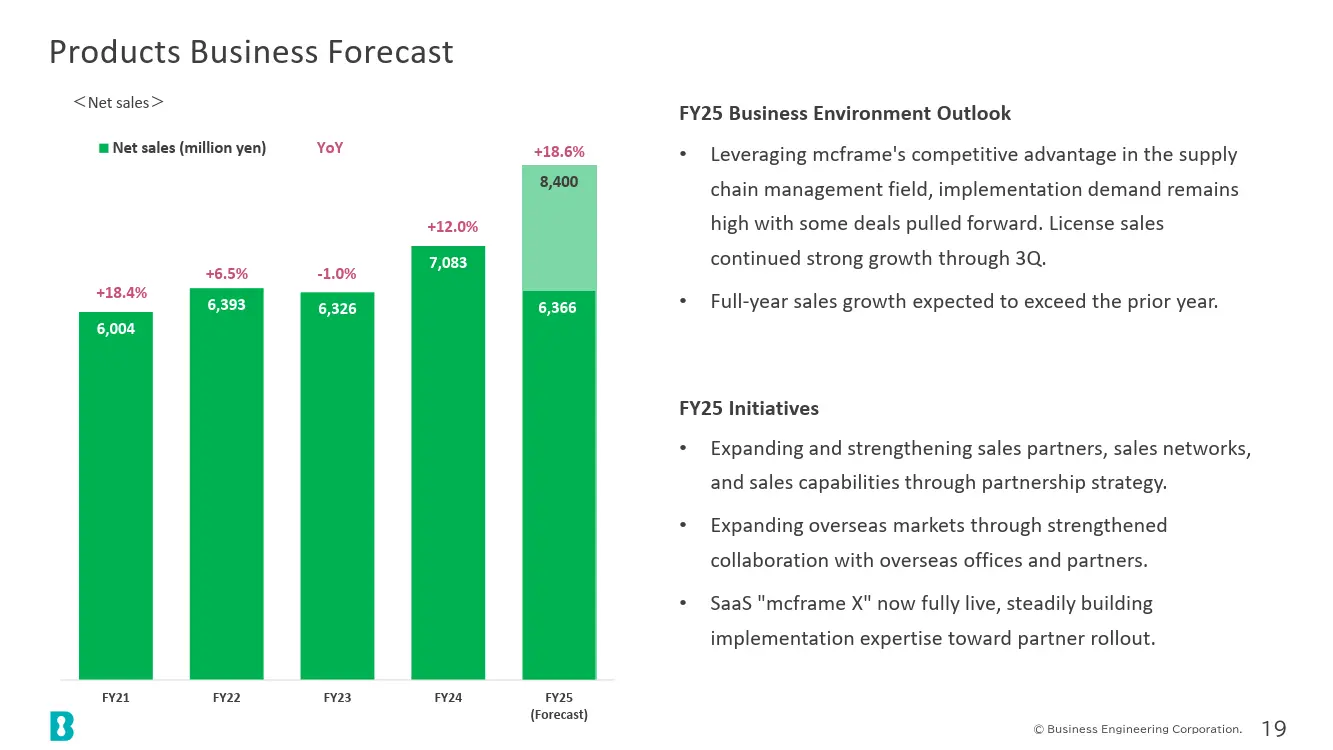
This section outlines the forecast for the Products Business. Net sales are expected to reach 8,400 million yen, an increase of 300 million yen from the previous forecast, representing an 18.6% increase year on year and significant growth exceeding the previous fiscal year.
In 3Q, pull-forward projects occurred, and license sales continued to grow at a high rate through 3Q.
In addition, as part of our initiatives, we are accumulating know-how for the implementation of SaaS-based "mcframe X" and promoting activities to expand this to partners.
Relationship Between AI and ERP/Business Applications
Having mentioned SaaS, there has recently been discussion about whether AI may replace SaaS and software.
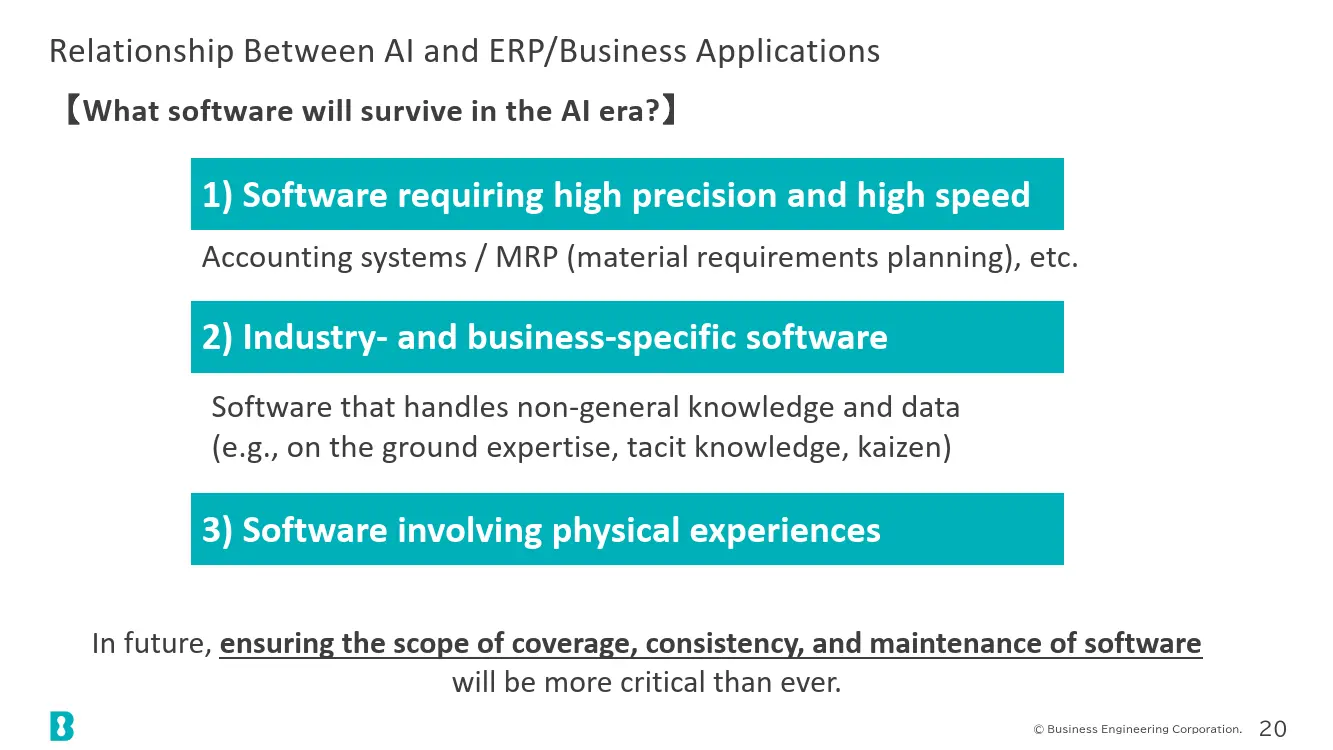
With regard to the ERP and business applications that we handle, we believe that they will incorporate and utilize AI technologies, and evolve together with AI in coexistence. As the reasons for this, we present the three points shown on the slide.
The first point is that these are software systems that require precision and speed. Examples include accounting systems that ensure the reliability of financial statements and MRP (Material Requirements Planning) systems that rapidly formulate production plans among a vast number of components. Because precision and speed are required, they have complex structures.
The second point is that they are industry- and business-specific software. This refers to systems that handle knowledge and data that are not general in nature. In other words, even in production management, the structure is designed not only for general production management but also to take into account the characteristics of each industry. For example, in the automotive industry, as shown on the slide, understanding of on-site operations and tacit knowledge, as well as responsiveness to kaizen, are required. In the pharmaceutical industry, it is necessary to support processes that ensure advanced quality assurance. These are the kinds of requirements that the software addresses.
The third point is that these are software systems that involve physical experiences. These are systems that support on-site operations, and this goes without saying.
For these reasons, we intend to continue utilizing and incorporating AI technologies going forward. At the same time, we believe that guaranteeing the scope of responsibility, consistency, and maintenance of software will become even more important in the future.
Net Sales and YoY Growth
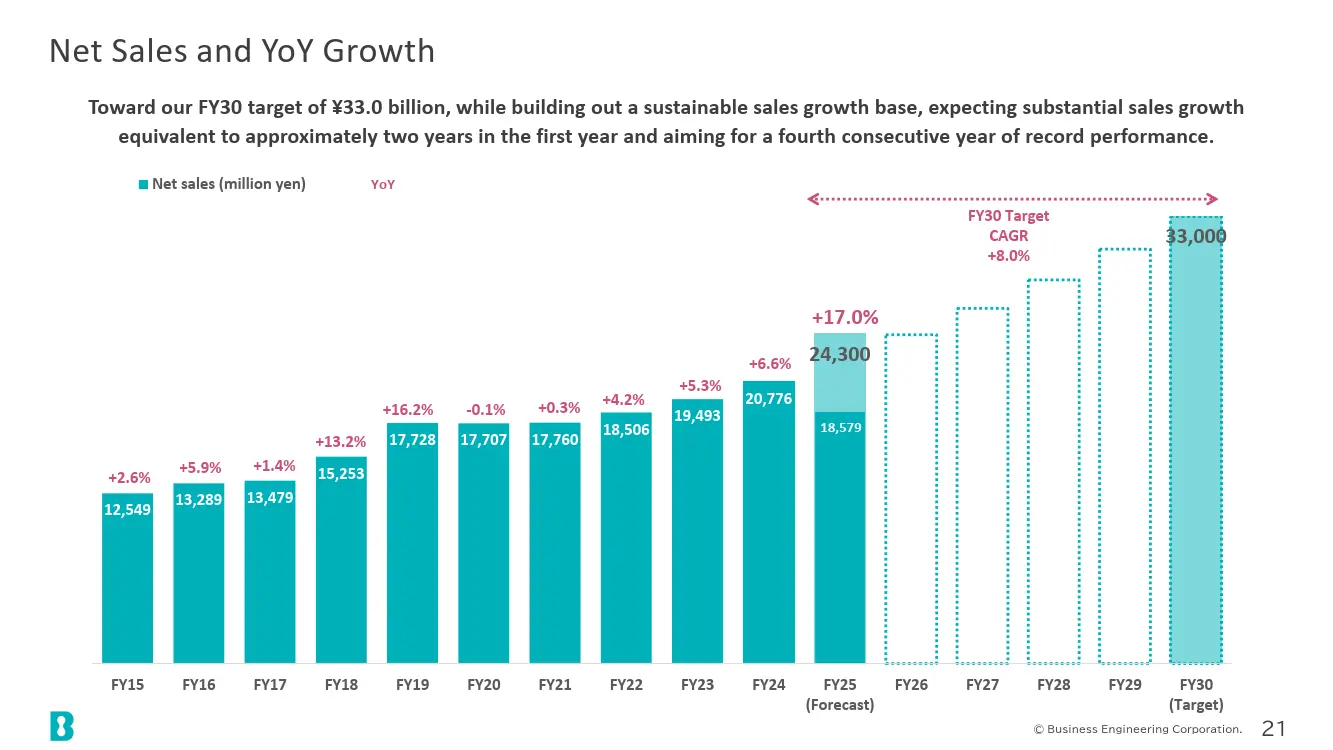
Next is the trend in net sales. We have set a target of 33.0 billion yen for FY2030. This fiscal year marks the first year toward that target, and we believe we have made a favorable start in this initial year.
Operating Profit & Operating Profit Margin
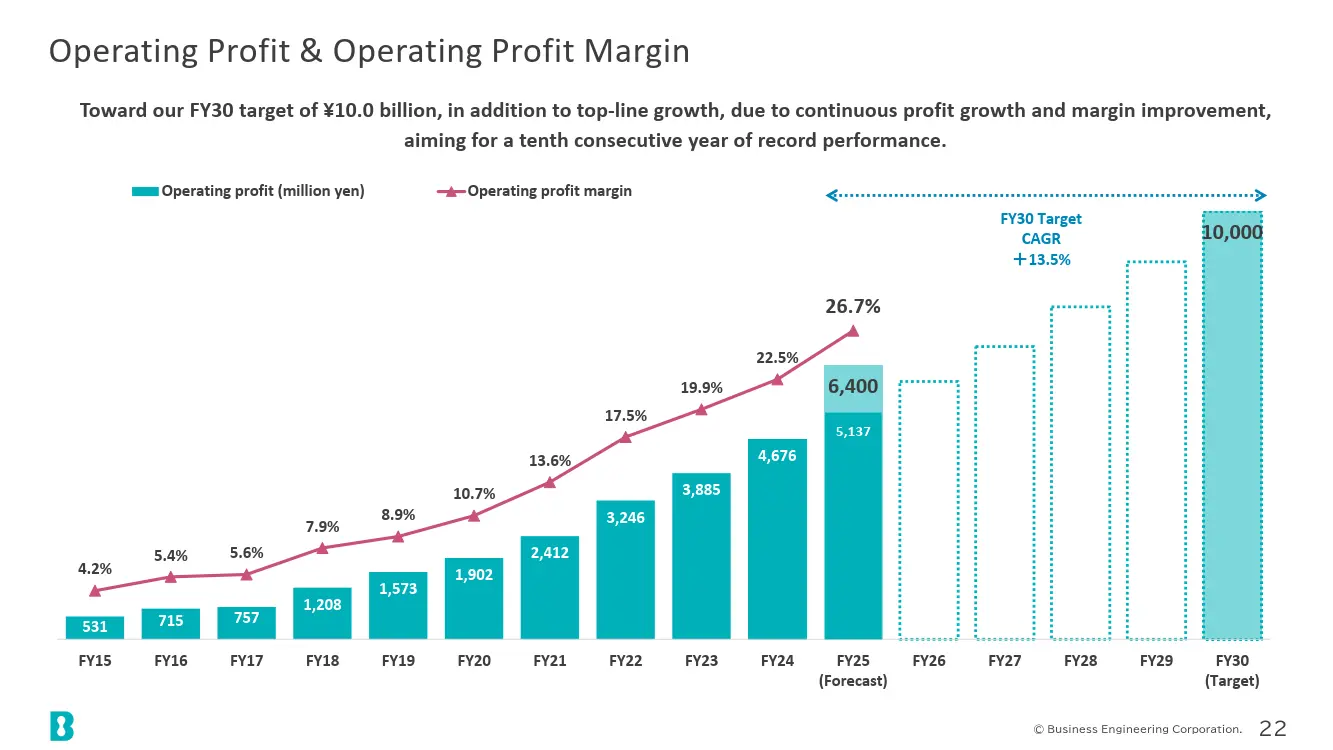
This slide shows the trend in operating profit. Toward the target of 10.0 billion yen for FY2030, we have made a very strong start this fiscal year.
mcframe License Sales & YoY Growth
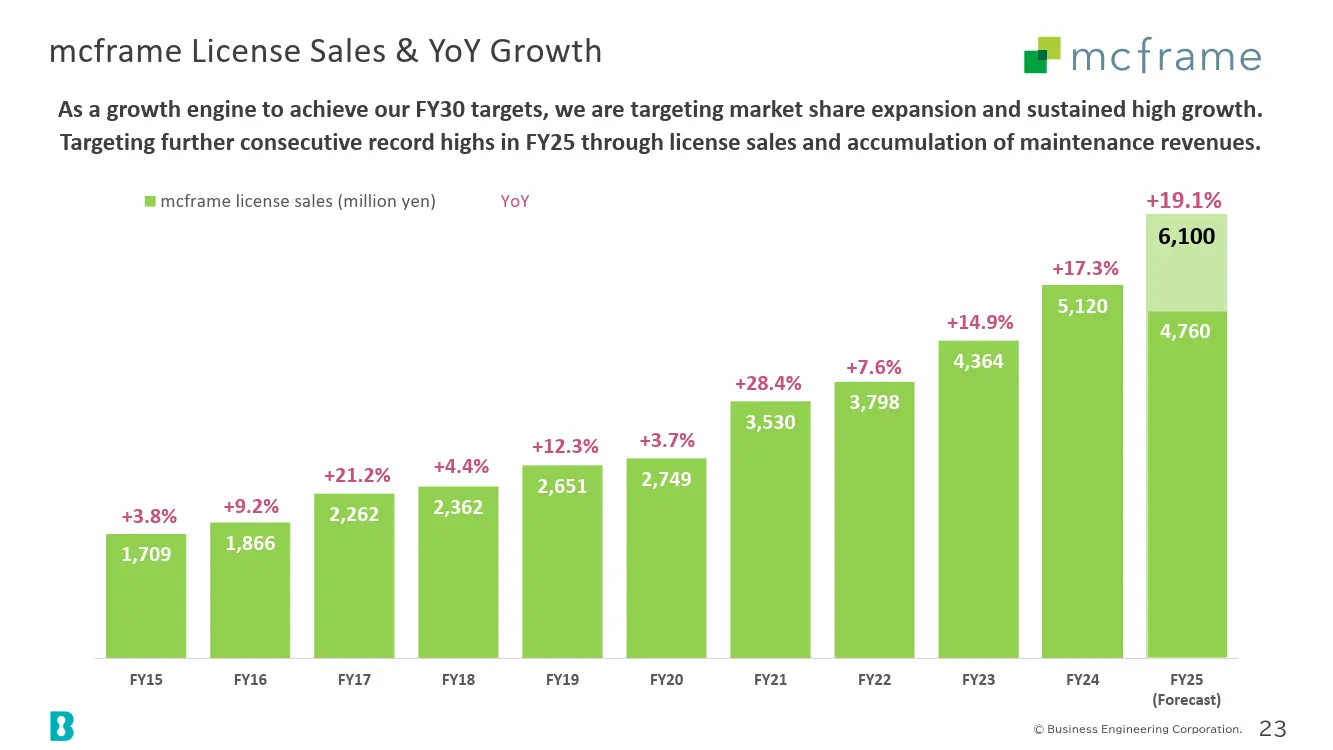
mcframe license sales are expected to increase by 100 million yen from the previous forecast to 6,100 million yen. This represents a 19.1% increase year on year, exceeding last year's growth rate of 17.3%. We will continue working toward achieving consecutive record-high sales this fiscal year.
Sales by Segment
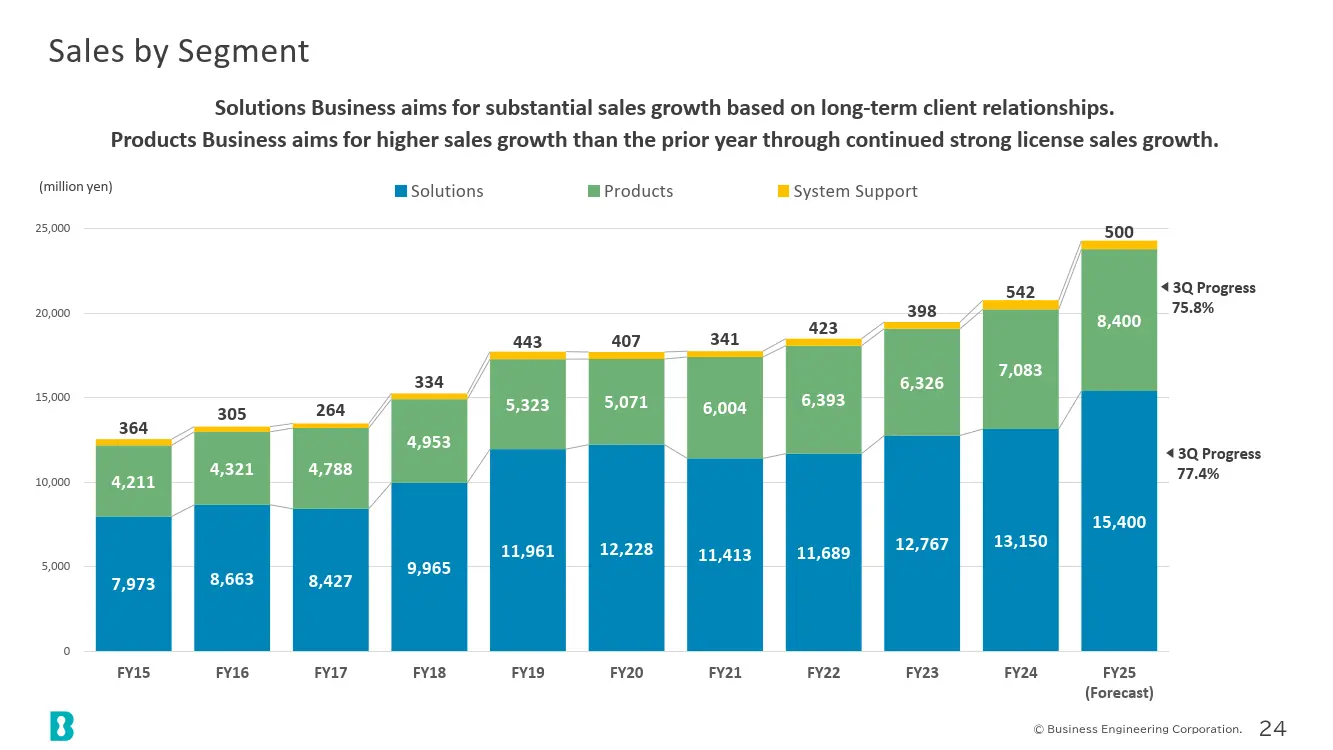
The graph on the slide shows the trend in net sales by segment. In FY2025, net sales made a significant jump, and the graph shows that both businesses achieved substantial growth.
Dividends (Annual dividend per share)
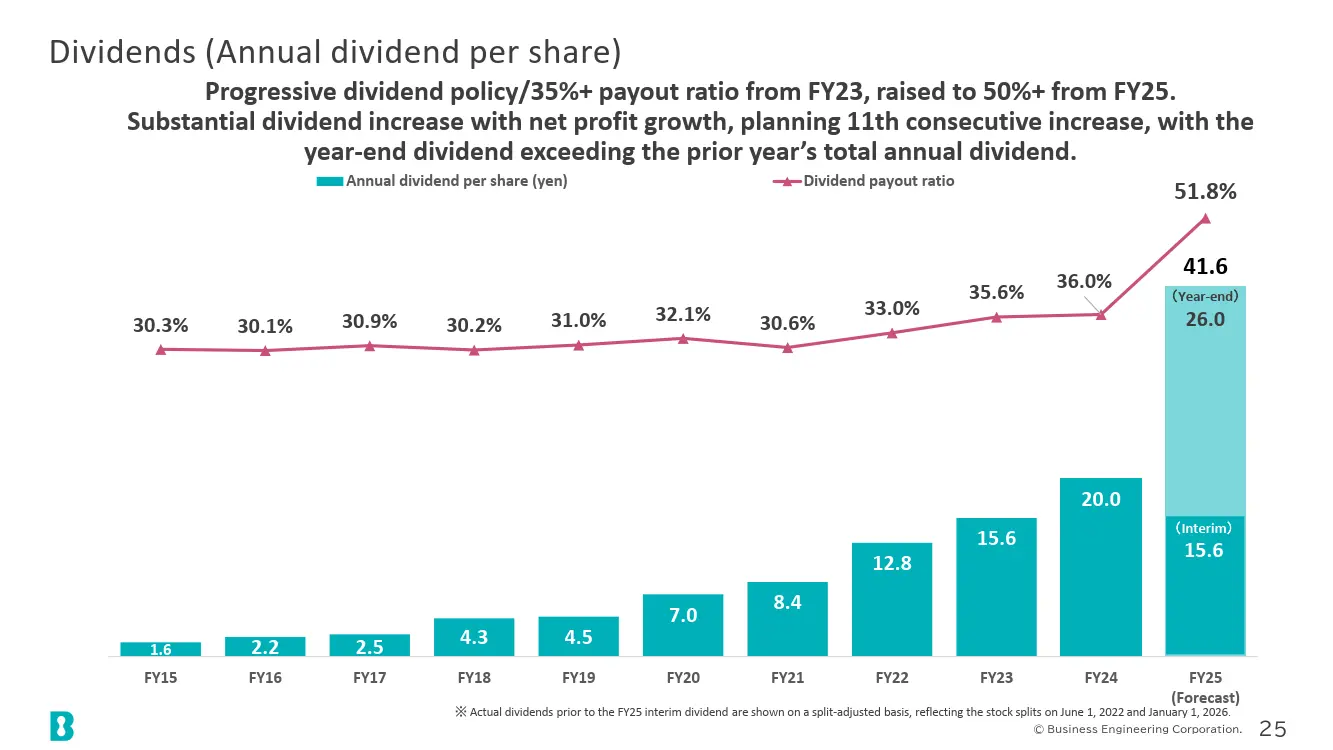
Finally, regarding dividends, we have implemented a progressive dividend policy since FY2023, and from this fiscal year we have raised the dividend payout ratio to over 50%.
The annual dividend for this fiscal year will be increased by 4 yen from the previous forecast to 41.6 yen per share, with a projected dividend payout ratio of 51.8%. This amount is more than double last year's 20 yen, and it will mark the 11th consecutive annual dividend increase.
Quarterly Income Statement (3-month)
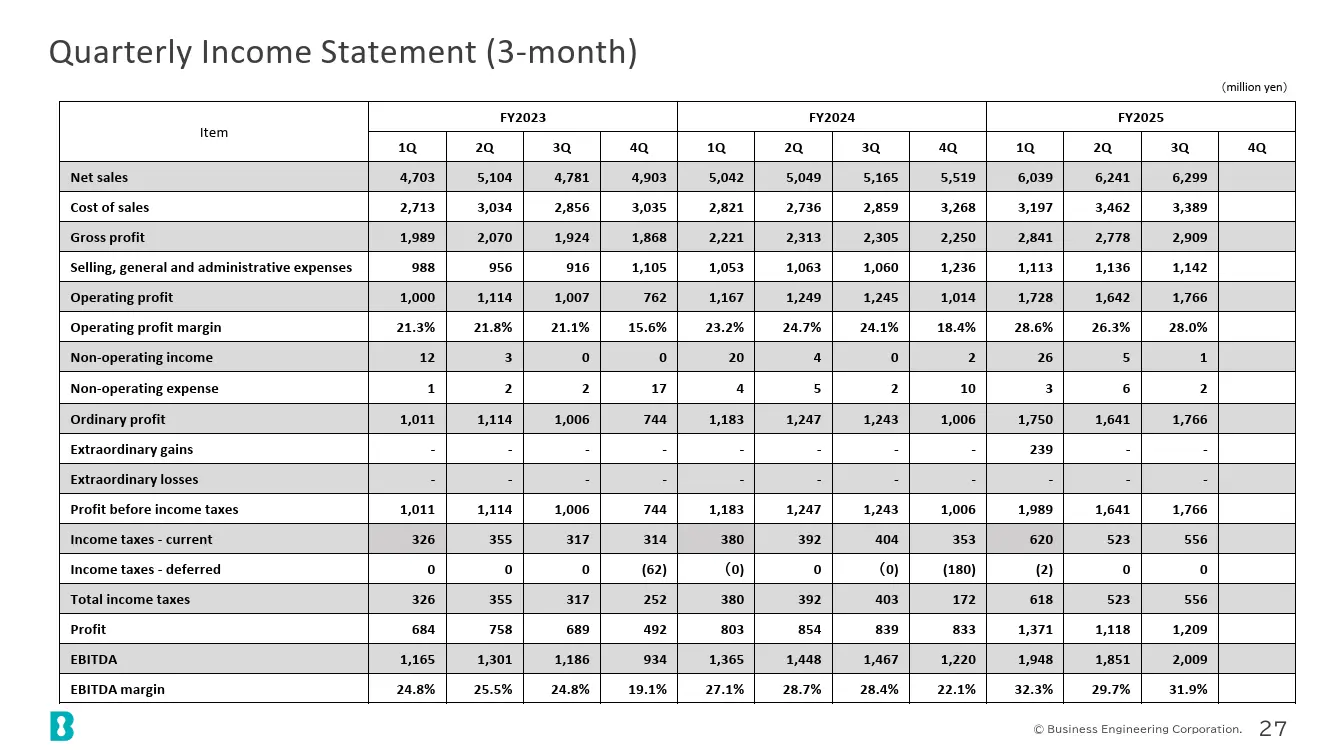
From this page onward, detailed numerical information is attached as a data book. We would appreciate it if you could refer to it.
Integrated Report 2025
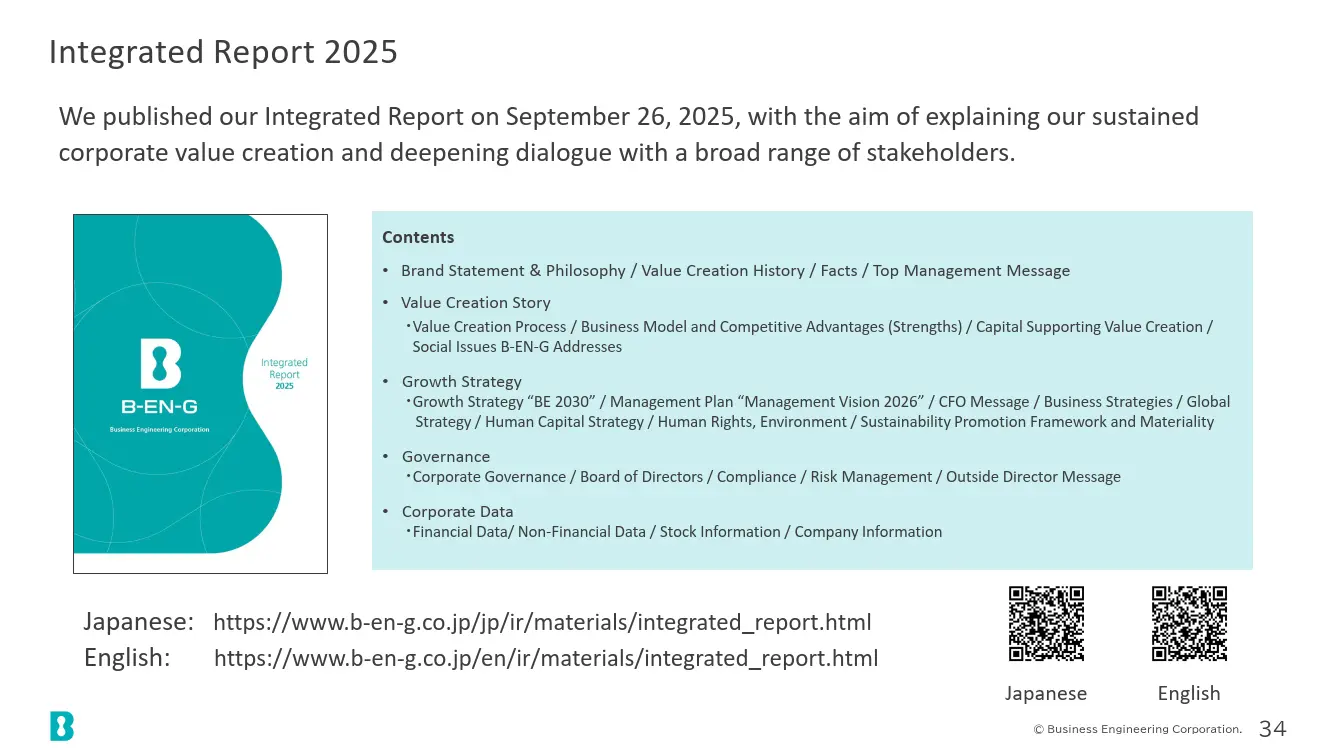
Our Integrated Report is available on our website as reference material for IR, and we would appreciate it if you could take a look.
Investors Guide
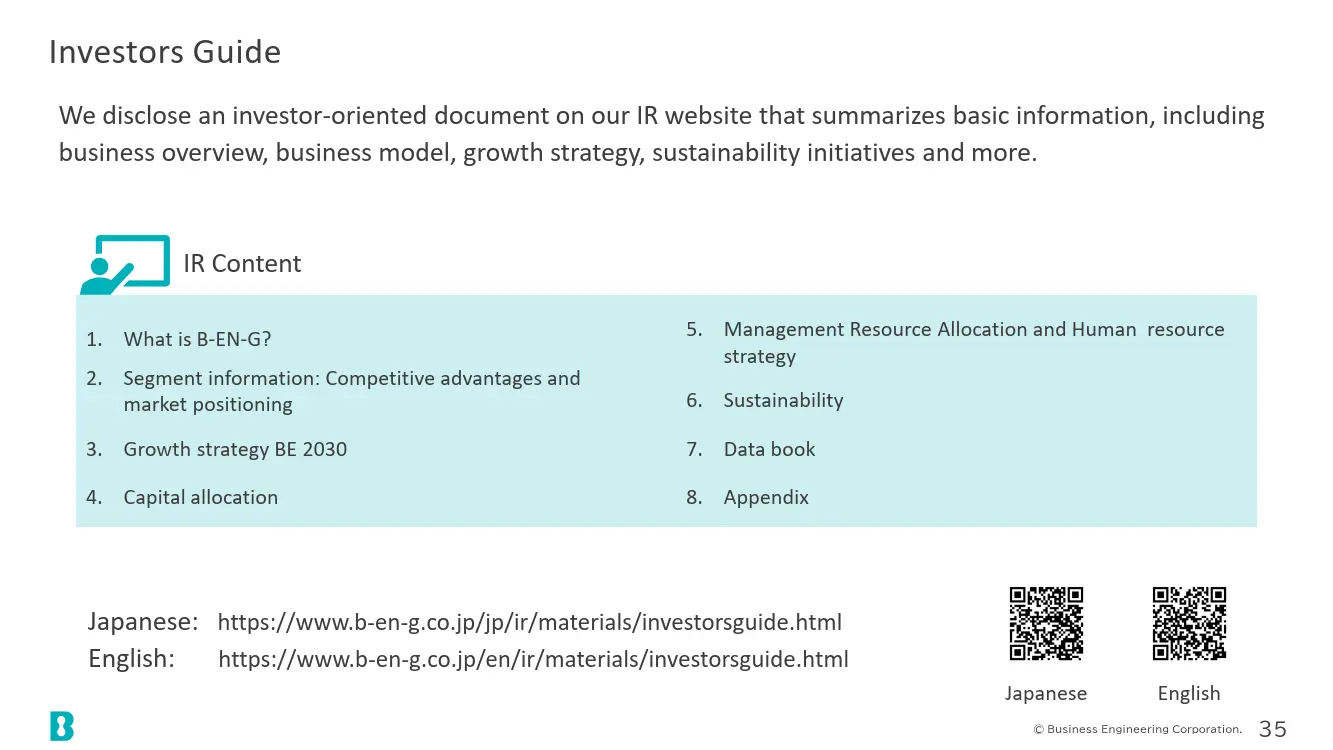
We also update our Investors Guide on an ongoing basis, and we would appreciate it if you could refer to it as well.
This concludes the explanation of our financial results for the third quarter of FY2025. Thank you very much.
Q&A Summary (1)
Q: The performance level in 4Q appears lower compared with the cumulative results through 3Q. Is there any negative factor behind this?
A: There are no negative factors. Although it may appear lower compared with the trend through 3Q, this is due to the following reasons.
In the Solutions Business, part of a major project went live in 3Q, and as that phase reached a milestone, net sales will stabilize. During this period, personnel who had been engaged in projects are being allocated to future activities, such as training.
In the Products Business, in license sales, some projects that had been expected in 4Q were pulled forward into 3Q. In addition, while there are currently many inquiries, many of them are scheduled to be concluded in 1Q of the next fiscal year. This does not indicate that a declining trend will continue.
Q&A Summary (2)
Q: Progress toward the FY2030 long-term targets appears very strong. Does this mean that this fiscal year is unusually strong and that the growth rate will decline next year, or does it indicate that the targets may be achieved ahead of schedule?
A: While this fiscal year may in some respects be unusually strong, and we do not expect this momentum to continue in a straight line, we aim to achieve continued growth in the coming fiscal years. As this is still the first year and we do not yet have full visibility through FY2030, we will not revise the FY2030 targets. However, rather than simply following the dotted-line average growth trajectory shown in the initial plan, we will aim to exceed it. At a minimum, we intend to formulate a plan that delivers growth again next fiscal year.
Q&A Summary (3)
Q: Regarding the impact of AI technologies, including AI-driven development, are there positive effects such as improvements in productivity?
A: We are utilizing AI both internally and externally, and positive effects are emerging. In internal development, for example, we use AI to create initial drafts, thereby improving productivity in the development process. In addition, by incorporating AI functions into our products and services, we are enhancing convenience for our customers.
Q&A Summary (4)
Q: In the full-year earnings forecast, net profit has been revised upward by the same amount (+400 million yen) as the upward revision to operating profit (+400 million yen). Does this mean you are expecting extraordinary income in 4Q?
A: It is not due to extraordinary income, but rather reflects the fact that tax credits under tax incentive measures (tax system to promote wage increases) are expected to be higher than initially anticipated. This has resulted in a reduced tax burden, which in turn is pushing up net profit.
Q&A Summary (5)
Q: What is the objective of the additional investment in Tokai Soft? Also, is there a specific intention behind keeping the stake at less than 5%?
A: The objective is to strengthen collaboration in the MES (Manufacturing Execution System) field within our Solutions Business. To expand this business, we aim to more firmly secure the company's resources. Regarding the investment ratio, we negotiated with a target of around 5%, but as a result of the transfer from existing shareholders, it happened to end up at slightly less than 5%.
Q&A Summary (6)
Q: Is it correct to understand that MES is growing into a major pillar in the Solutions Business, second only to SAP (ERP) in scale? Also, can we expect continued high growth in this field?
A: That is correct. Currently, the field we refer to as "Supply Chain Execution," which includes MES, is the largest area after ERP, and the scale of these solutions is increasing. We expect continued high growth and look forward to Tokai Soft playing an active role through this investment, particularly in the "Apriso" product area.